Notice: this Wiki will be going read only early in 2024 and edits will no longer be possible. Please see: https://gitlab.eclipse.org/eclipsefdn/helpdesk/-/wikis/Wiki-shutdown-plan for the plan.
Difference between revisions of "Linux Tools Project/News/NewIn30"
(→Data Driven Analysis) |
(Document more SystemTap features.) |
||
| Line 231: | Line 231: | ||
[[Image:DataSetImportOnly.png]] ''The Import Data Set button as it appears while a Graph Set is not being viewed.'' | [[Image:DataSetImportOnly.png]] ''The Import Data Set button as it appears while a Graph Set is not being viewed.'' | ||
| + | |||
| + | ==== Live Updates to Graphing Preferences ==== | ||
| + | |||
| + | Changes made to graphing preferences (such as refresh delay and the number of visible graph items) are now applied to existing graphs immediately as they are made, instead of only on graphs created afterwards. | ||
=== Data Filters === | === Data Filters === | ||
| Line 247: | Line 251: | ||
Data filters now get applied to all graphs that rely on the filtered data, as opposed to only the data table in a Data View. | Data filters now get applied to all graphs that rely on the filtered data, as opposed to only the data table in a Data View. | ||
| − | |||
| − | |||
| − | |||
| − | |||
=== Tapset Tools === | === Tapset Tools === | ||
| Line 257: | Line 257: | ||
The Probe Alias and Function views (as well as the Kernel Browser) have undergone significant UI improvements. For instance, in the Function view, listed functions and parameters now properly show their types, and the Probe Alias view now categorizes available probes as either Static Probes (provided by SystemTap) or Probe Aliases (provided by tapsets). | The Probe Alias and Function views (as well as the Kernel Browser) have undergone significant UI improvements. For instance, in the Function view, listed functions and parameters now properly show their types, and the Probe Alias view now categorizes available probes as either Static Probes (provided by SystemTap) or Probe Aliases (provided by tapsets). | ||
| + | |||
| + | [[Image:ProbeAlias.png]] | ||
| + | |||
| + | [[Image:Function.png]] | ||
==== Definition Viewing ==== | ==== Definition Viewing ==== | ||
| Line 269: | Line 273: | ||
[[Image:StapSelectTargetScript.png]] | [[Image:StapSelectTargetScript.png]] | ||
| + | |||
| + | === Script Running === | ||
| + | |||
| + | ==== Out-Of-Workspace Script Launches ==== | ||
| + | |||
| + | SystemTap script launch shortcuts are now available for script files located outside of the Eclipse workspace. This means it is now possible to launch an out-of-workspace script file with Ctrl-F11 or by right-clicking it and choosing "Run As->SystemTap Script", options which were previously only available for workspace script files. | ||
| + | |||
| + | ==== Port Specification ==== | ||
| + | |||
| + | When running a SystemTap script on a remote host, it is now possible to specify which port to use. This feature is found in the General tab of a SystemTap script's Run Configurations menu. | ||
| + | |||
| + | [[Image:RunWithPortSpec.png]] | ||
== Valgrind == | == Valgrind == | ||
Revision as of 14:11, 28 May 2014
{{#eclipseproject:tools.linuxtools}}
| Linux Tools | |
| Website | |
| Download | |
| Community | |
| Mailing List • Forums • IRC • mattermost | |
| Issues | |
| Open • Help Wanted • Bug Day | |
| Contribute | |
| Browse Source |
Contents
- 1 ChangeLog plugin
- 2 GCov
- 3 GProf
- 4 LibHover
- 5 LTTng
- 6 Man page viewer
- 7 Oprofile
- 8 Perf
- 9 Profiling framework
- 10 RPM
- 11 Systemtap
- 12 Valgrind
ChangeLog plugin
GCov
Annotation Model Redesign
For too long, Gcov has annotated source code in a separate editor from the one often used for active development. The annotation model may now work with C/C++ Editors, allowing users to view annotations and edit their code from the same editor.
GProf
LibHover
LTTng
Project Explorer View Enhancements
Display of Analyses
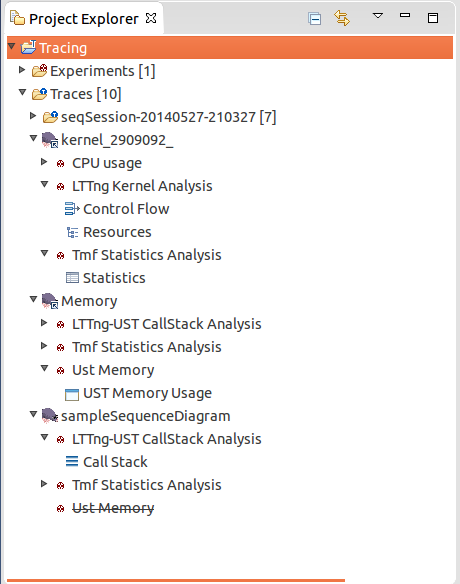
The Project Explorer now displays analyses per trace that are available for the respective trace type.
Refer to the User Guide for detailed information about the display of analyses.
Folder Structures
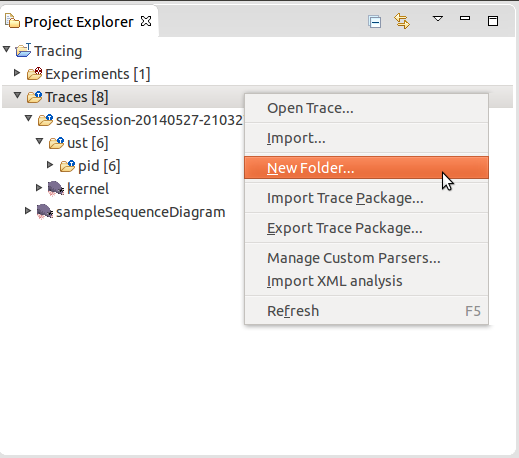
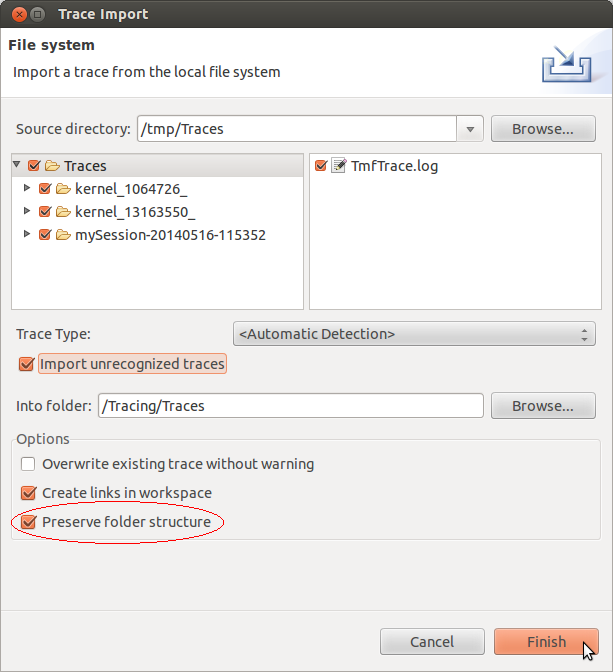
The Tracing projects in the Project Explorer now support folder structures for traces. This allows users to organize their traces in folders. All existing import features are updated to preserve the source folder structure.
Refer to the User Guide for detailed information about the support of folder structures.
LTTng CPU Usage View
A new LTTng Kernel Analysis is available that analyzes the CPU usage per process over time of the traced system.
Refer to the User Guide for detailed information about the CPU Usage view.
LTTng UST Memory Usage View
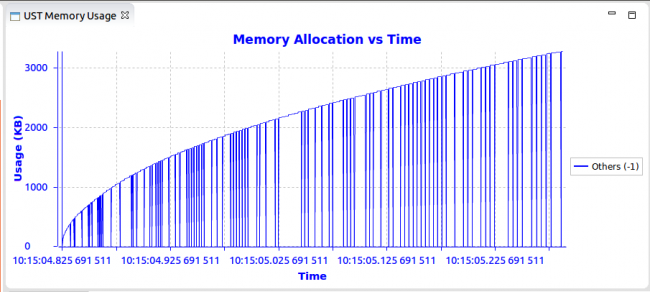
A new LTTng UST Analysis is available that analyzes the Memory allocation over time of the traced system.
Refer to the User Guide for detailed information about the Memory Usage view.
LTTng UST Trace Type
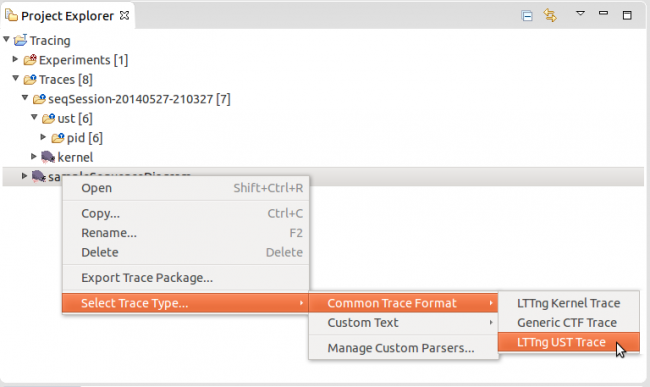
An new trace type is defined for analyzing LTTng UST (User Space Traces).
LTTng UST Call Stack View
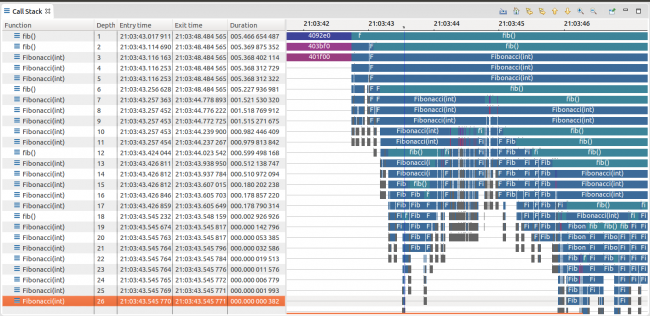
The Call Stack view allows the user to visualize the call stack per thread over time, if the application and trace provide this information. There is support in the LTTng-UST integration plug-in to display the call stack of applications traced with the liblttng-ust-cyg-profile.so library (see the liblttng-ust-cyg-profile man page for additional information).
Refer to the User Guide for detailed information about the Call Stack view.
LTTng Trace Synchronization
It is possible to synchronize traces from different machines so that they have the same time reference. Events from the reference trace will have the same timestamps as usual, but the events from traces synchronized with the first one will have their timestamps transformed according to the formula obtained after synchronization.
Refer to the User Guide for detailed information about the LTTng trace synchronization.
Histogram View Enhancements
The Histogram view now supports colors per trace when analyzing a set of traces in an experiment.
Refer to the User Guide for detailed information about the Histogram view.
Trace Import Enhancements
Trace Import Wizard
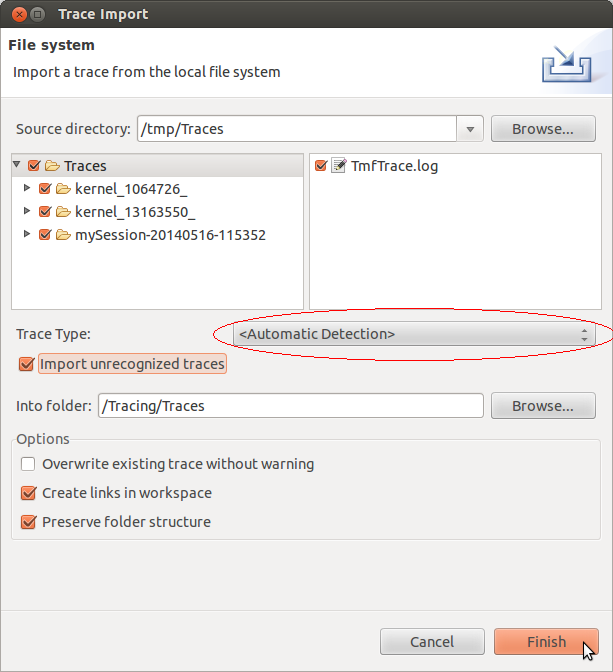
The trace import and Drag & Drop features now support automatic trace type detection. The auto detection algorithm will validate the trace against all known trace types. If multiple trace types are valid, a trace type is chosen based on a confidence criteria. The validation process and the computation of the confidence level are trace type specific and is supported in this release for LTTng Kernel, LTTng UST, Custom Text and Custom XML traces. For GDB Tracepoint Analysis traces the trace type has to be set manually.
Refer to the User Guide for detailed information about importing traces.
Opening a Trace
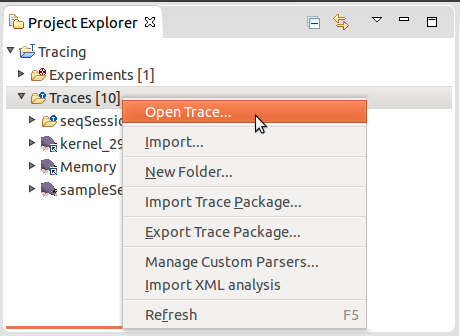
It is now possible to open a single trace directly from the media. The trace will be linked to the default tracing project (Tracing), the trace type will be set automatically and then it will be opened.
Refer to the User Guide for detailed information about opening a trace from the media.
Removal of Batch Import Wizard
The Batch Import Trace wizard was removed from the product. Use the enhanced Import Trace Wizard, Import Trace Package or Open Trace feature to import traces to a tracing project.
Refer to the User Guide for detailed information about importing traces.
Custom Text and XML Wizard
The Custom Text and XML wizard support now nano-seconds in the timestamp format.
Refer to the User Guide for detailed information about Custom Text and XML wizards.
Framework Improvements
Analysis Framework
Analysis modules are useful to tell the user exactly what can be done with a trace. The analysis framework provides an easy way to access and execute the modules and open the various outputs available.
Analyses can have parameters they can use in their code. They also have outputs (e.g. views) registered to them to display the results from their execution.
Refer to the TMF Developer Guide for detailed information about the Analysis Framework.
Data Driven Analysis
It is possible to define custom trace analysis, and a way to view them in an XML format. These kind of analyses allow doing more with the trace data than what the default analyses shipped with TMF offer. It can be customized to a specific problem and fine-tuned to show exactly what you're looking for. Right now it's possible to define XML state providers and an XML time graph views.
Refer to the User Guide for detailed information about Data Driven Analysis.
Event Matching Framework
Event matching consists in taking an event from a trace and linking it to another event in a possibly different trace. The example that comes to mind is matching network packets sent from one traced machine to another traced machine. These matches can be used, for example, to synchronize traces.
Refer to the TMF Developer Guide for detailed information about the Event Matching Framework.
Trace Synchronization
Trace synchronization consists in taking traces, taken on different machines, with a different time reference, and finding the formula to transform the timestamps of some of the traces, so that they all have the same time reference.
Refer to the TMF Developer Guide for detailed information about Trace Synchronization.
Support for SWT Charts
The Tracing and Monitoring Framework now comes with the support of SWT charts. Base classes are provided for plotting of X-Y-charts and bar charts over time. These base implementations include synchronization across TMF views (i.e. time selection/range synchronization) and zooming support.
Refer to the TMF Developer Guide for detailed information about creating a custom chart view.
Support for Experiment Types
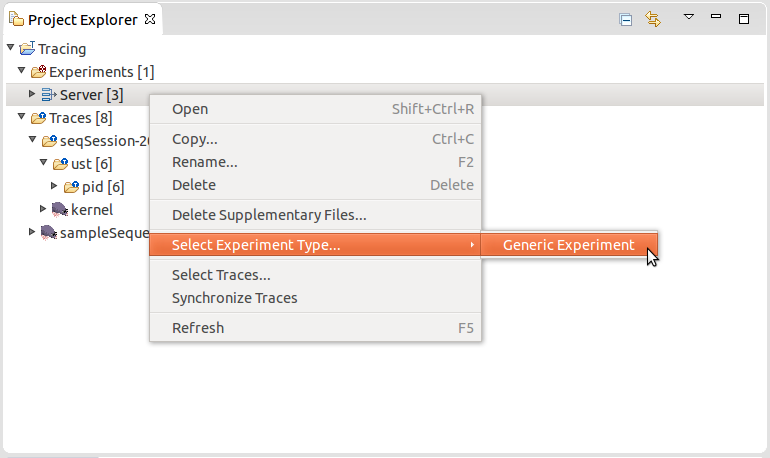
It is now possible to define experiment types for experiment specific analyses. Experiment types can be selected at runtime for each experiment in the Experiments folder. By default the type Generic Experiment is selected that will analyze the set of traces ordered by timestamp.
Persistent Trace Index
It's now possible to persist the trace index to disk when implementing a new trace type. All existing trace types that are delivered by the Linux Tools project (e.g. LTTng Kernel Trace) have been updated to store the trace index to disk.
Man page viewer
Oprofile
Perf
Profiling framework
RPM
Systemtap
Graphing
One-Click Graphing
Working with the new Graphing menu interface from Linuxtools 2.2, Systemtap IDE can now automatically generate graphs for capturing & displaying the output of a Systemtap script. This feature is available in the Graphing tab of a script's Run Configurations menu.
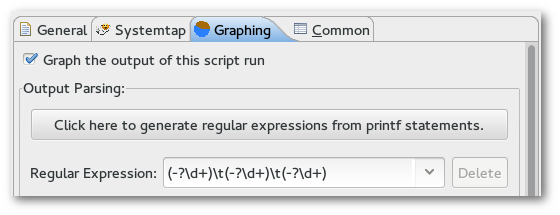
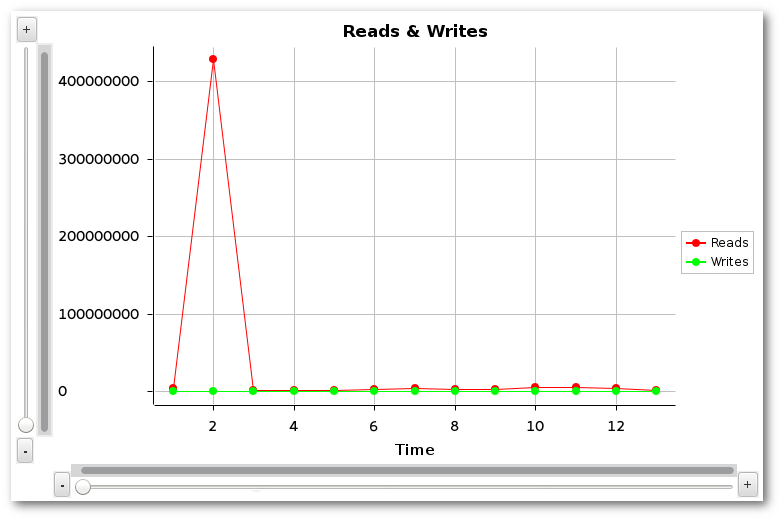
This feature works by scanning a Systemtap script for all formatted print (printf) statements, and constructing appropriate regular expressions that will capture their output. These regexs are added to the list of regular expressions used for graphing output, just as if they had been entered manually.
For example, say you want to graph the output of the following script:
	global read, write, start

	probe begin {
		start = gettimeofday_s()
	}
	probe syscall.write {
		write += count
	}

	probe timer.ms(1000) {
		printf("%d\t%d\t%d\n", (gettimeofday_s()-start), read, write)
		read=0
		write=0
	}
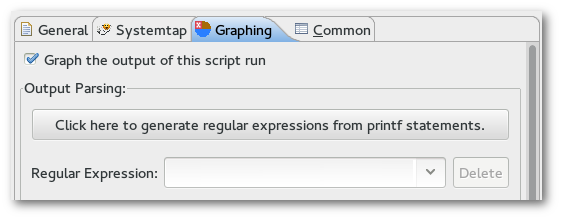
As usual, graphing options are available in the script's Run Configurations menu, under the Graphing tab, but there is now a new button in the "Output Parsing" section:
Click it, and the list of regular expressions will be populated with whatever is needed to capture all of your script's formatted output.
Graph Scrolling/Scaling
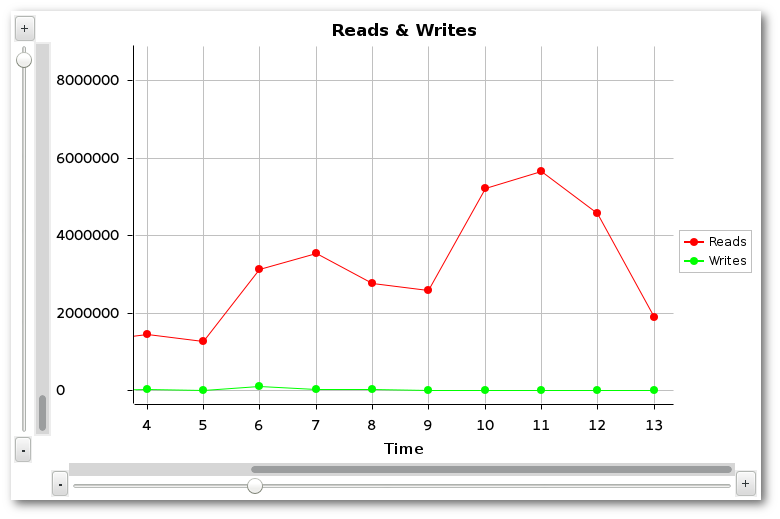
It is now possible to smoothly zoom in/out of either axis of any Scatter, Line, Area, and Bar Graph. Once zoomed in, it is also possible to scroll through the axes to focus your view elsewhere in the graph.
To zoom in/out of a Scatter/Line/Area Graph axis, use the +/- buttons or the Scale bar beneath / to the left of a graph. To scroll through a graph's viewing area, use the horizontal/vertical scroll bars provided.
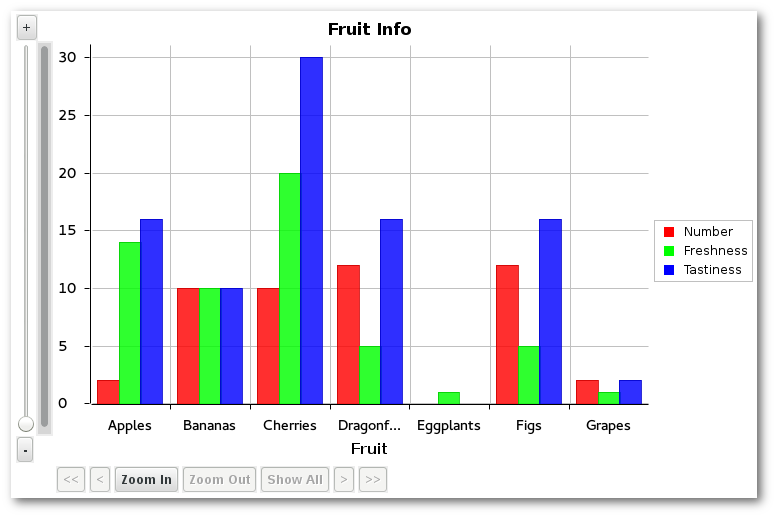
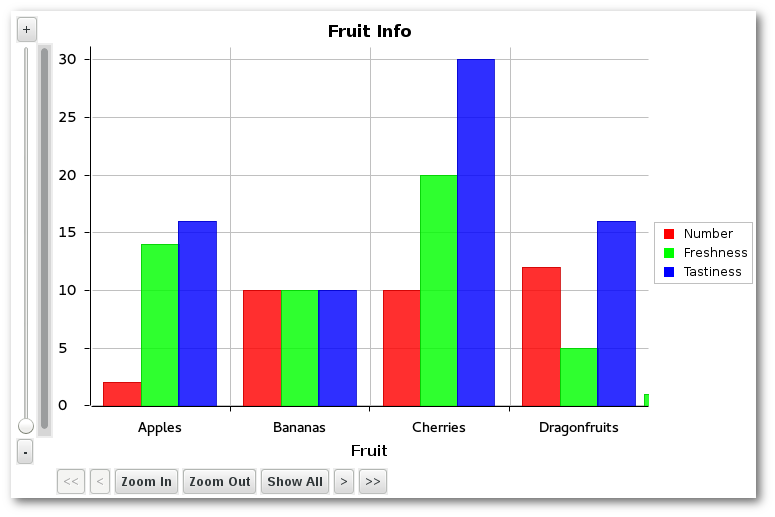
Similar controls are available for Bar Graphs & Pie Charts, for scrolling through bars or pies.
Bar Graph Categories
Bar Graphs now stores x-axis values as categories. This means it is now possible for them to have names (Strings) as x-axis values, rather than numeric data only.
Specialized controls are available for zooming & scrolling through the bars of a Bar Graph.
Graph Coordinate Tooltips
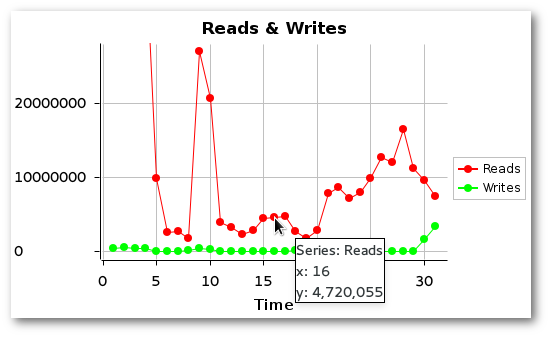
Hovering over any data point on a graph now displays detailed information about that point's coordinates. This feature is available for all graph types.
Graph Image Export
The ability to export a graph as an image has been restored. To do so, simply click the "Save Graph" toolbar button, which is visible while a graph is displayed.
Data Set Import/Export
The ability to import and export data sets has also been restored. This allows output that has been captured from a script to be saved into a standalone file, which can be loaded again later for further examination.
To save a data set, click the "Export Data Set" toolbar button while viewing the set that is to be saved (or a graph it provides data to). To load a data set, use the "Import Data Set" toolbar button, which is available at all times.
 The Data Set toolbar buttons that appear while viewing a Graph Set. (Blue/left: Export. Red/Right: Import.)
 The Import Data Set button as it appears while a Graph Set is not being viewed.
Live Updates to Graphing Preferences
Changes made to graphing preferences (such as refresh delay and the number of visible graph items) are now applied to existing graphs immediately as they are made, instead of only on graphs created afterwards.
Data Filters
Improved UI
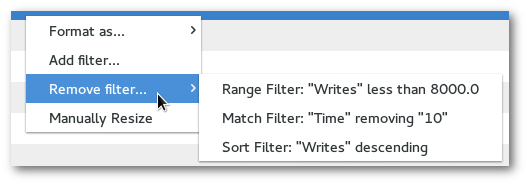
The UI for adding data filters in a Data View has been improved. For instance, a descriptive list of all applied filters are now shown when attempting to remove a filter.
Unbounded Range Filters
Range Filters may now filter unbounded ranges of data. For instance, it is now possible to filter out data below a specified minimum, without having to apply an upper bound on acceptable data (or vice versa).
Graph Data Filtering
Data filters now get applied to all graphs that rely on the filtered data, as opposed to only the data table in a Data View.
Tapset Tools
View UI Improvements
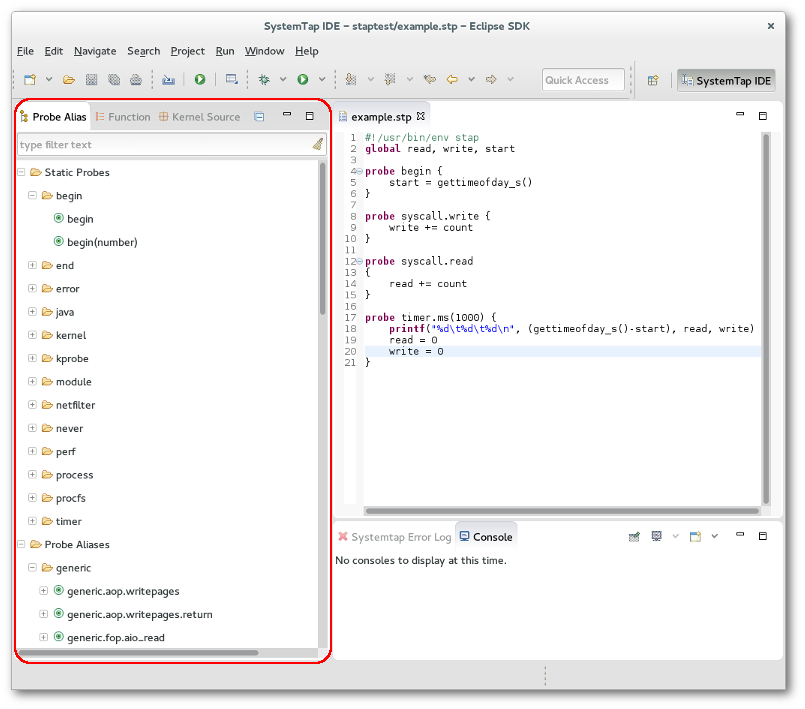
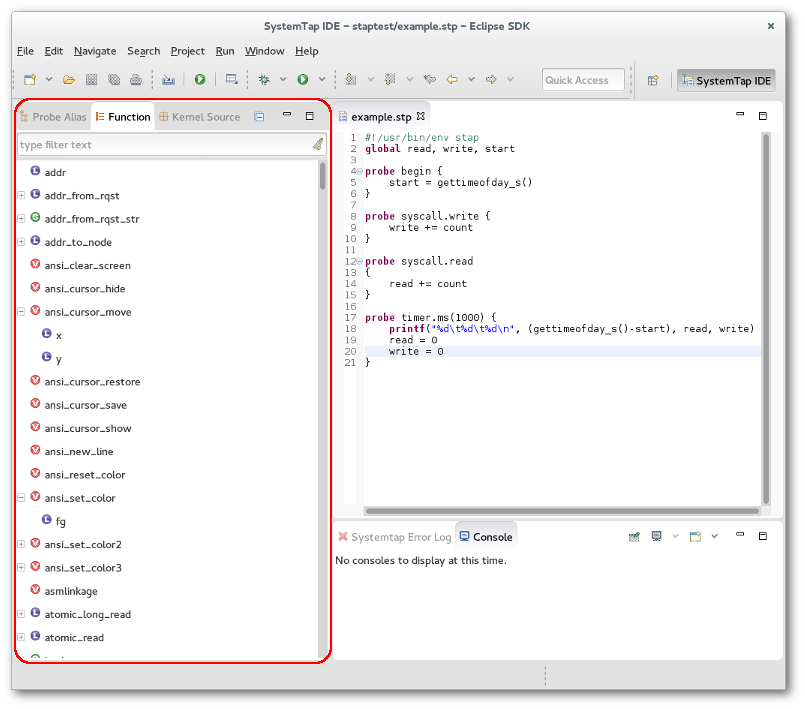
The Probe Alias and Function views (as well as the Kernel Browser) have undergone significant UI improvements. For instance, in the Function view, listed functions and parameters now properly show their types, and the Probe Alias view now categorizes available probes as either Static Probes (provided by SystemTap) or Probe Aliases (provided by tapsets).
Definition Viewing
The ability to view the definition of a function or probe definition now works as advertised by the User Guide. To view the file where a tapset function or probe is defined, right click its entry in the Probe Alias/Function view and select "View Definition".
Improved Probe/Function Insertion
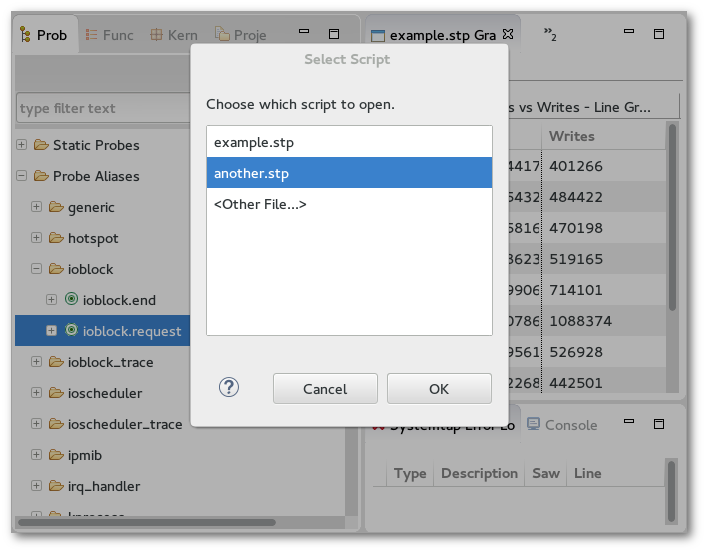
As usual, double-clicking an entry in the Probe Alias/Function views will insert the chosen item to the currently-active .stp file. However, if this is done while no .stp file is in focus, a dialog now appears to let you choose which file the probe/function is to be inserted in.
For instance, after double-clicking a probe entry when multiple .stp files are open but none are in focus, the dialog that appears will allow you to choose which of the opened files to add the probe to.
Script Running
Out-Of-Workspace Script Launches
SystemTap script launch shortcuts are now available for script files located outside of the Eclipse workspace. This means it is now possible to launch an out-of-workspace script file with Ctrl-F11 or by right-clicking it and choosing "Run As->SystemTap Script", options which were previously only available for workspace script files.
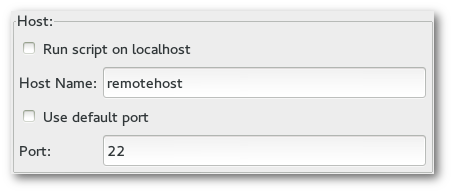
Port Specification
When running a SystemTap script on a remote host, it is now possible to specify which port to use. This feature is found in the General tab of a SystemTap script's Run Configurations menu.

