Notice: this Wiki will be going read only early in 2024 and edits will no longer be possible. Please see: https://gitlab.eclipse.org/eclipsefdn/helpdesk/-/wikis/Wiki-shutdown-plan for the plan.
Difference between revisions of "Linux Tools Project/LTTng2/User Guide"
(→Opening a trace using a custom parser) |
(→Custom Parser) |
||
| Line 524: | Line 524: | ||
* Select '''File''' > '''New''' > '''Other...''' > '''Tracing''' > '''Custom Text Parser''' | * Select '''File''' > '''New''' > '''Other...''' > '''Tracing''' > '''Custom Text Parser''' | ||
* Open the '''Manage Custom Parsers''' dialog from the '''Project Explorer''' view menu, select the '''Text''' radio button and click the '''New...''' button | * Open the '''Manage Custom Parsers''' dialog from the '''Project Explorer''' view menu, select the '''Text''' radio button and click the '''New...''' button | ||
| − | + | ||
| + | [[Image:CustomTextParserInput.png]] | ||
| + | |||
Fill out the first wizard page with the following information: | Fill out the first wizard page with the following information: | ||
| Line 569: | Line 571: | ||
Click the '''Next''' button to go to the second page of the wizard. | Click the '''Next''' button to go to the second page of the wizard. | ||
| + | [[Image:CustomTextParserOutput.png]] | ||
| + | |||
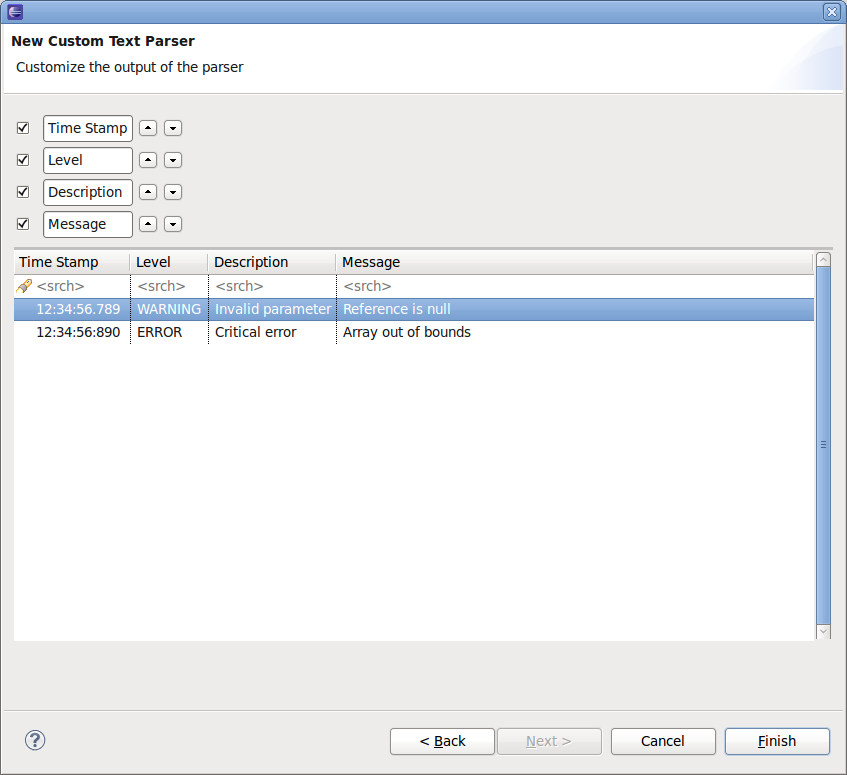
On this page, the list of default and custom data is shown, along with a preview of the custom parser log table output. | On this page, the list of default and custom data is shown, along with a preview of the custom parser log table output. | ||
| Line 587: | Line 591: | ||
* Select '''File''' > '''New''' > '''Other...''' > '''Tracing''' > '''Custom XML Parser''' | * Select '''File''' > '''New''' > '''Other...''' > '''Tracing''' > '''Custom XML Parser''' | ||
* Open the '''Manage Custom Parsers''' dialog from the '''Project Explorer''' view menu, select the '''XML''' radio button and click the '''New...''' button | * Open the '''Manage Custom Parsers''' dialog from the '''Project Explorer''' view menu, select the '''XML''' radio button and click the '''New...''' button | ||
| + | |||
| + | [[Image:CustomXMLParserInput.png]] | ||
Fill out the first wizard page with the following information: | Fill out the first wizard page with the following information: | ||
| Line 636: | Line 642: | ||
Click the '''Next''' button to go to the second page of the wizard. | Click the '''Next''' button to go to the second page of the wizard. | ||
| + | |||
| + | [[Image:CustomXMLParserOutput.png]] | ||
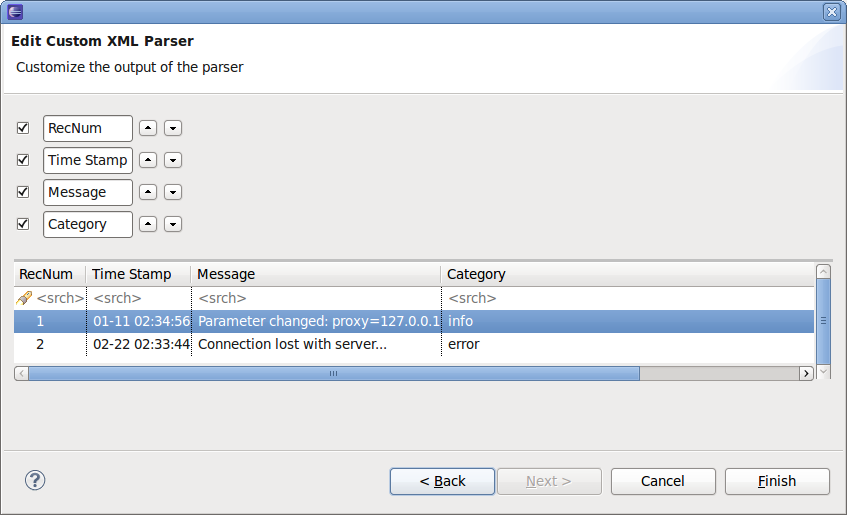
On this page, the list of default and custom data is shown, along with a preview of the custom parser log table output. | On this page, the list of default and custom data is shown, along with a preview of the custom parser log table output. | ||
| Line 653: | Line 661: | ||
* Select '''Manage Custom Parsers''' from the '''Project Explorer''' view menu. | * Select '''Manage Custom Parsers''' from the '''Project Explorer''' view menu. | ||
| + | |||
| + | [[Image:ManageCustomParsers.png]] | ||
The ordered list of currently defined custom parsers for the selected type is displayed on the left side of the dialog. | The ordered list of currently defined custom parsers for the selected type is displayed on the left side of the dialog. | ||
Revision as of 14:14, 12 June 2012
{{#eclipseproject:technology.linux-distros}}
| Linux Tools | |
| Website | |
| Download | |
| Community | |
| Mailing List • Forums • IRC • mattermost | |
| Issues | |
| Open • Help Wanted • Bug Day | |
| Contribute | |
| Browse Source |
Contents
- 1 Overview
- 2 Installation
- 3 LTTng
- 3.1 Tracing Perspective
- 3.2 Project View
- 3.2.1 Creating a Tracing Project
- 3.2.2 Importing Traces in a Project
- 3.2.3 Selecting a Trace Type
- 3.2.4 Creating a Experiment
- 3.2.5 Selecting Traces for an Experiment
- 3.2.6 Removing Traces from an Experiment
- 3.2.7 Renaming a Trace or Experiment
- 3.2.8 Copying a Trace or Experiment
- 3.2.9 Deleting a Trace or Experiment
- 3.2.10 Deleting Supplementary Files
- 3.2.11 Opening a Trace or Experiment
- 3.2.12 Drag and Drop
- 3.3 Events View
- 3.4 Histogram View
- 3.5 Statistics View
- 3.6 Colors View
- 3.7 Filters View
- 3.8 Time Chart View
- 3.9 Environment Variables View
- 3.10 Custom Parser
- 3.11 LTTng Tracer Control
- 3.11.1 Control View
- 3.11.1.1 Creating a New Connection to a Remote Host
- 3.11.1.2 Disconnecting from a Remote Host
- 3.11.1.3 Connecting to a Remote Host
- 3.11.1.4 Deleting to a Remote Host Connection
- 3.11.1.5 Creating a Tracing Session
- 3.11.1.6 Enabling Channels - General
- 3.11.1.7 Enabling Channels On Session Level
- 3.11.1.8 Enabling Channels On Domain Level
- 3.11.1.9 Enabling and Disabling Channels
- 3.11.1.10 Enabling Events - General
- 3.11.1.11 Enabling Kernel Events On Session Level
- 3.11.1.12 Enabling UST Events On Session Level
- 3.11.1.13 Enabling Events On Domain Level
- 3.11.1.14 Enabling Events On Channel Level
- 3.11.1.15 Enabling and Disabling Events
- 3.11.1.16 Enabling Tracepoint Events From Provider
- 3.11.1.17 Adding Contexts to Channels and Events of a Domain
- 3.11.1.18 Adding Contexts to All Events of a Channel
- 3.11.1.19 Adding Contexts to a Event of a Specific Channel
- 3.11.1.20 Start Tracing
- 3.11.1.21 Stop Tracing
- 3.11.1.22 Destroying a Tracing Session
- 3.11.1.23 Refreshing the Node Information
- 3.11.1.24 Quantifing LTTng overhead (Calibrate)
- 3.11.1.25 Importing Session Traces to a Tracing Project
- 3.11.2 Properties View
- 3.11.3 LTTng Tracer Control Preferences
- 3.11.1 Control View
- 4 LTTng Kernel Analysis
- 5 Limitations
- 6 How to use LTTng to diagnose problems
- 7 References
Overview
LTTng (Linux Trace Toolkit, next generation) is a highly efficient tracing tool for Linux that can be used to track down kernel and application performance issues as well as troubleshoot problems involving multiple concurrent processes and threads. It consists of a set of kernel modules, daemons - to collect the raw tracing data - and a set of tools to control, visualize and analyze the generated data. It also provides support for user space application instrumentation.
For more information about LTTng, refer to the project site
Note: This User Guide covers the integration of the latest LTTng (v2.0) in Eclipse. The legacy version (v0.x) of both the tracer and the LTTng integration are no longer being maintained but are still available for download. The User Guide for the legacy LTTng integration is available here.
The latest version of this User Guide can be found here.
About Tracing
Tracing is a troubleshooting technique used to understand the behavior of an instrumented application by collecting information on its execution path. A tracer is the software used for tracing. Tracing can be used to troubleshoot a wide range of bugs that are otherwise extremely challenging. These include, for example, performance problems in complex parallel systems or real-time systems.
Tracing is similar to logging: it consists in recording events that happen in a system at selected execution locations. However, compared to logging, it is generally aimed at developers and it usually records low-level events at a high rate. Tracers can typically generate thousands of events per second. The generated traces can easily contain millions of events and have sizes from many megabytes to tens of gigabytes. Tracers must therefore be optimized to handle a lot of data while having a small impact on the system.
Traces may include events from the operating system kernel (IRQ handler entry/exit, system call entry/exit, scheduling activity, network activity, etc). They can also consists of application events (a.k.a UST - User Space Tracing) or a mix of the two.
For the maximum level of detail, tracing events may be viewed like a log file. However, trace analyzers and viewers are available to derive useful information from the raw data. These programs must be specially designed to handle quickly the enormous amount of data a trace may contain.
LTTng integration
The LTTng plug-in for Eclipse provides an Eclipse integration for the control of the LTTng tracer as well as fetching and visualization of the traces produced. It also provides the foundation for user-defined analysis tools.
The LTTng Eclipse plug-in provides the following views:
- Project - an extension to the standard Eclipse Project view tailored for tracing projects
- Control - to control the tracer and configure the tracepoints
- Events - a versatile view that presents the raw events in tabular format with support for searching, filtering and bookmarking
- Statistics - a view that that provides simple statistics on event occurrences by type
- Histogram - a view that displays the event density with respect to time in traces
These views can be extended or tailored for specific trace types (e.g. kernel, HW, user app).
At present, the LTTng Eclipse plug-in for Eclipse supports the following kernel-oriented analysis:
- Control Flow - to visualize processes state transitions
- Resources - to visualize system resources state transitions
Although the control and fetching parts are targeted at the LTTng tracer, the underlying framework can also be used to process any trace that complies with the Common Trace Format (CTF). CTF specifies a very efficient and compact binary trace format that is meant to be application-, architecture-, and language-agnostic.
Features
The LTTng Eclipse plug-in has a number of features to allow efficient handling of very large traces (and sets of large traces):
- Support for arbitrarily large traces (larger than available memory)
- Support for correlating multiple time-ordered traces
- Support for zooming down to the nanosecond on any part of a trace or set of traces
- Views synchronization of currently selected event
- Efficient searching and filtering of events
- Support for trace bookmarks
There is also support for the integration of non-LTTng trace types:
- Built-in CTF parser
- Dynamic creation of customized parsers (for XML and text traces)
Installation
This section describes the installation of the LTTng tracer and the LTTng Eclipse plug-ins as well as their dependencies.
LTTng Tracer
While the Eclipse plug-ins can run on the standard Eclipse platforms (Linux, Mac, Windows), the LTTng tracer and its accompanying tools run on Linux.
The tracer and tools have been available for download in Ubuntu since 12.04. They can easily be installed with the following command:
> sudo apt-get install lttng-tools
For other distributions, older Ubuntu distributions, or the latest, bleeding edge LTTng tracer, please refer to the LTTng website for installation information.
Note: The LTTng tracer (and accompanying tools) is required only if you want to create your own traces (the usual case). If you intend to simply analyze existing traces then it is not necessary to install the tracer.
LTTng Eclipse Plug-ins
The easiest way to install the LTTng plug-ins for Eclipse is through the Software Updates and Add-ons menu. For information on how to use this menu, refer to this link.
The legacy (Classic :-)) Eclipse LTTng (v0.x) is also available as an optional download. Refer to here for installation and verification instructions.
The LTTng plug-ins are structured as a stack of features/plug-ins as following:
- CTF - A CTF parser that can also be used as a standalone component
- Feature: org.eclipse.linuxtools.ctf
- Plug-ins: org.eclipse.linuxtools.ctf.core, org.eclipse.linuxtools.ctf.parser
- TMF - Tracing and Monitoring Framework a framework for generic trace processing
- Feature: org.eclipse.linuxtools.tmf
- Plug-ins: org.eclipse.linuxtools.tmf.core, org.eclipse.linuxtools.tmf.ui
- LTTng - The wrapper for the LTTng tracer control. Can be used for kernel or application tracing.
- Feature: org.eclipse.linuxtools.lttng2
- Plug-ins: org.eclipse.linuxtools.lttng2.core, org.eclipse.linuxtools.lttng2.ui
- LTTng Kernel - Analysis components specific to Linux kernel traces
- Feature: org.eclipse.linuxtools.lttng2.kernel
- Plug-ins: org.eclipse.linuxtools.lttng2.kernel.core, org.eclipse.linuxtools.lttng2.kernel.ui
LTTng Eclipse Dependencies
The Eclipse LTTng controls the LTTng tracer through an ssh connection even if the tracer is running locally (the 'degenerate' case).
Therefore, the target system (where the tracer runs) needs to run an ssh server to which you have permission to connect.
On the host side (where Eclipse is running), you also need to have Eclipse RSE (Remote System Explorer) installed to handle the SSH connection and transport. The RSE can be installed the standard way (Help > Install New Software... > General Purpose Tools > Remote System Explorer End-User Runtime).
Installation Verification
Here are the quick steps to verify that your installation is functional:
- Start Eclipse
- Open the LTTng perspective
- Create a Tracing project
- Right-click in the Project view and select "New Project"
- Enter the name of your project (e.g. "MyLTTngProject")
- The project will be created. It will contain 2 empty folders: "Traces" and "Experiments"
- Import a sample trace
- Right-click on the newly created project "Traces" folder and select "Import..."
- Navigate to the sample LTTng trace that you want to visualize
- Select that trace (check box), select the trace type (e.g. CTF: Kernel Trace), and press "Finish"
- The newly imported trace should appear under the Traces folder
- Visualize the trace
- Expand the Traces folder
- Double-click on the trace
- The trace should load and the views be populated
If an error message is displayed, you might want to double-check that the trace type is correctly set (right-click on the trace and "Select Trace Type...").
Refer to Tracing Perspective for detailed description of the views and their usage.
To download sample LTTng traces, go to [1]. At the bottom of the page there is a link to some sample LTTng 2.0 kernel traces.
LTTng
Tracing Perspective
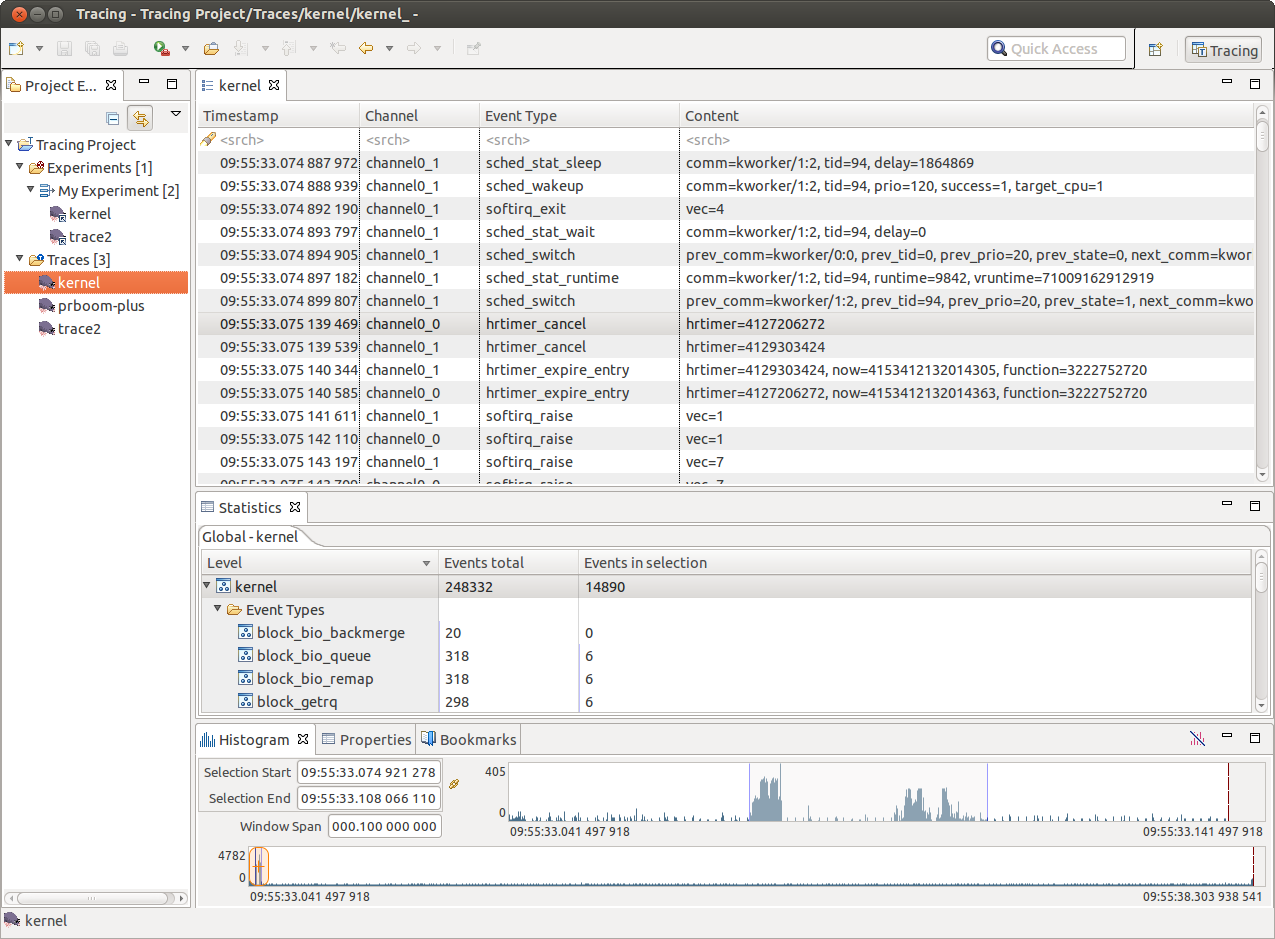
The Tracing perspective is part of the Tracing and Monitoring Framework (TMF) and groups the following views:
The views are synchronized i.e. selecting an event, a timestamp, a time range, etc will update the other views accordingly.
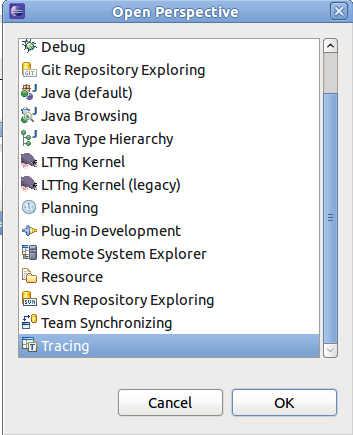
The perspective can be opened from the Eclipse Open Perspective dialog (Window > Open Perspective... > Other).
On top to these views, the Tracing and Monitoring Framework (TMF) feature provides a set of generic tracing specific views, such as:
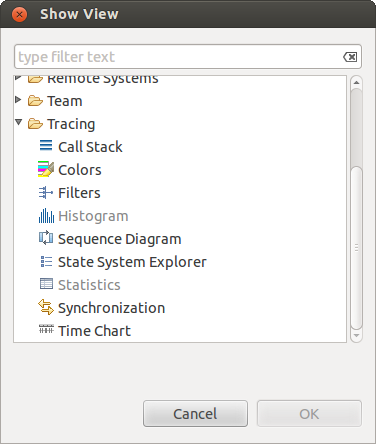
To open one of the above Tracing view, use the Eclipse Show View dialog (Window > Show View > Other.... Then select the relevant view from the Tracing.
Additionally, the LTTng feature provides a LTTng Tracer Control. It comes with a dedicated Control View.
Project View
The project view is the standard Eclipse Project Explorer. Tracing projects are well integrated in the Eclipse's Common Navigator Framework. The Project Explorer shows Tracing project with a small "T" decorator in the upper right of the project folder icon.
Creating a Tracing Project
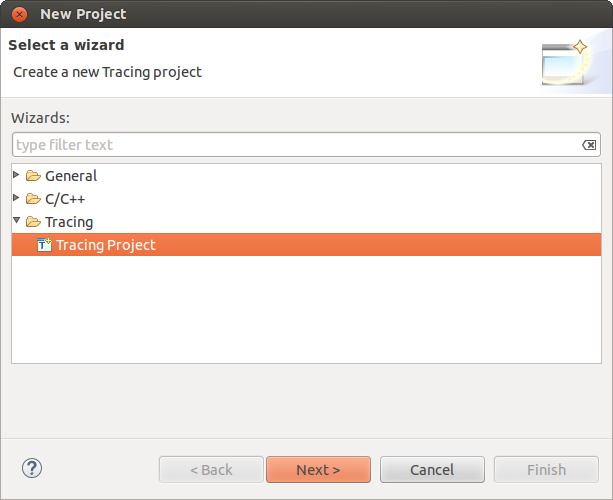
A new Tracing project can be created using the New Tracing Project wizard. To create a new Tracing select File > New > Project... from the main menu bar or alternatively form the context-sensitive menu (click with right mouse button in the Project Explorer.
The first page of project wizard will open.
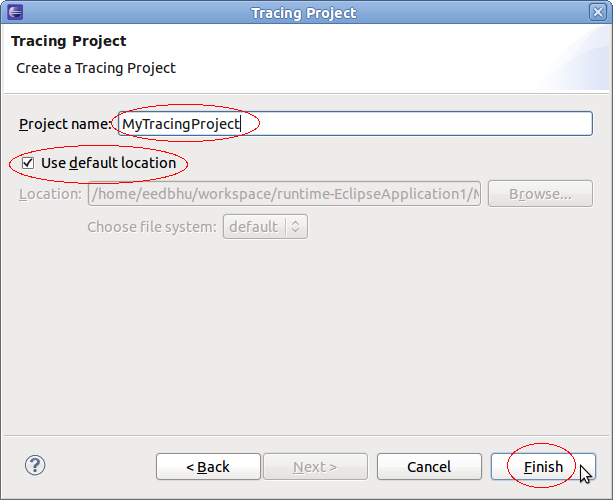
In the list of project categories, expand category Tracing and select Tracing Project and the click on Next >. A second page of the wizard will show. Now enter the a name in the field Project Name, select a location if required and the press on Finish.
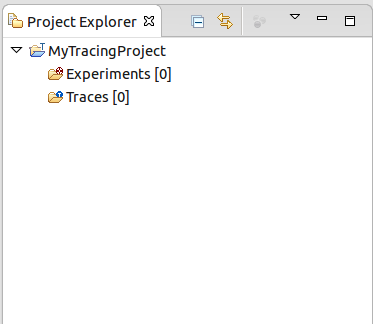
A new project will appear in the Project Explorer view.
Tracing projects have two sub-folders: Traces which holds the individual traces, and Experiments which holds sets of traces that we want to correlate.
Importing Traces in a Project
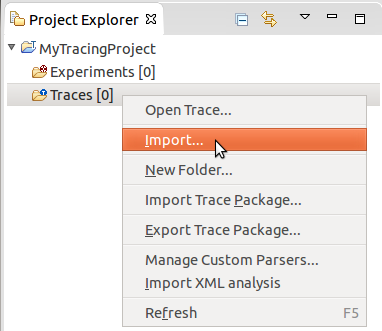
The Traces folder holds the set of traces available for experiments. To import a trace to the traces folder, select the Traces folder and click the right mouse button. Then select Import... menu item in the context-sensitive menu.
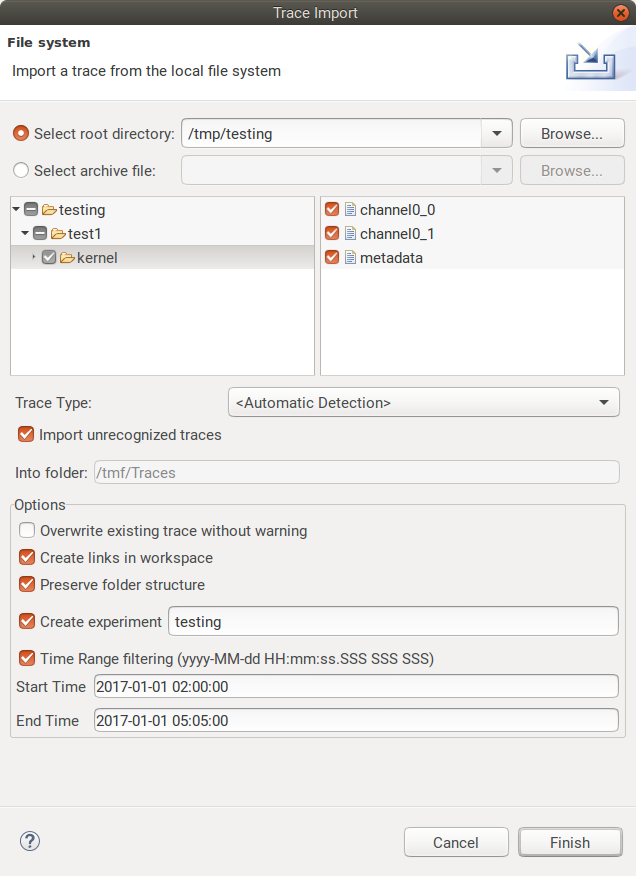
A new display will show for selecting traces to import. By default, it shows the correct destination directory where the traces will be imported to. Now, specify the location of the traces by entering the path directly in the Source Directory or by browsing the file system (click on button browse). Then select the traces to import in the list of files and folders. Optionally, select the Trace Type from the drop-down menu, select or deselect the checkboxes for Overwrite existing trace without warning and Create links into workspace. When all options are configured, click on Finish.
Note, that traces of certain types (e.g. LTTng Kernel) are actually a composite of multiple channel traces grouped under a folder. It is the folder that has to be imported.
Upon successful importing the traces will be stored in the Traces folder. If a trace type was selected in the import dialog, then the corresponding icon will be displayed. Linked traces will have a little arrow as decorator on the right bottom corner.
Note that trace type is an extension point of the Tracing and Monitoring Framework (TMF). Depending on the which features are loaded, the list of trace types can vary.
Selecting a Trace Type
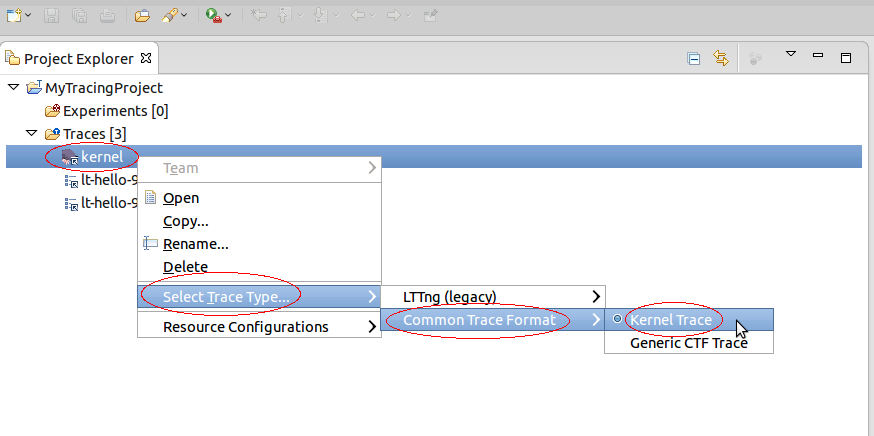
If no trace type was selected a trace type as to be associated to a trace before it can be opened. To select a trace type select the relevant trace and click the right mouse button. In the context-sensitive menu, select Select Trace Type... menu item. A sub-menu will show will all available trace type categories. From the relevant category select the required trace type. The examples, below show how to select the Common Trace Format types LTTng Kernel and Generic CTF trace.
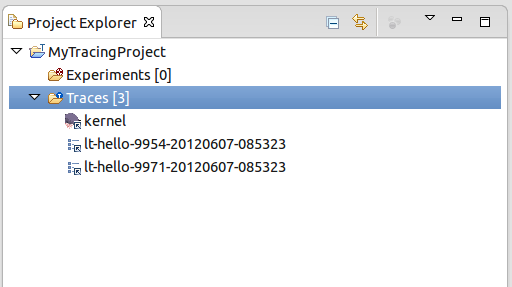
After selecting the trace type, the trace icon will be updated with the corresponding trace type icon.
Creating a Experiment
An experiment consists in an arbitrary number of aggregated traces for purpose of correlation. In the degenerate case, an experiment can consist of a single trace. The experiment provides a unified, time-ordered stream of the individual trace events.
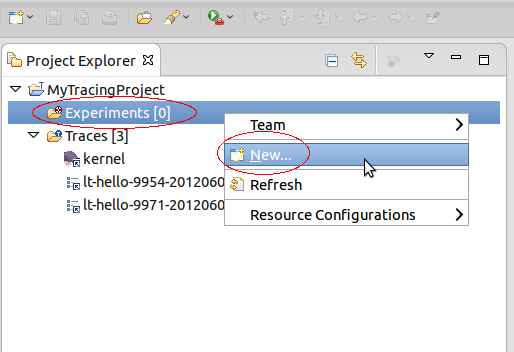
To create an experiment, select the folder Experiments and click the right mouse button. Then select New....
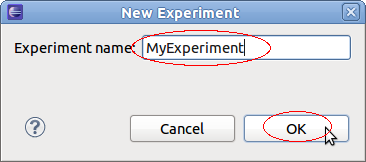
A new display will open for entering the experiment name. Type the name of the experiment in the text field Experiment Name and the click on OK.
Selecting Traces for an Experiment
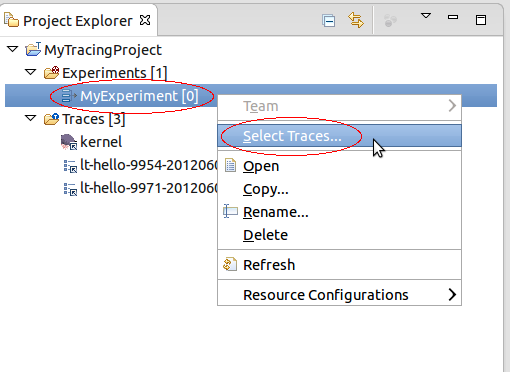
After creating an experiment, traces need to be added to the experiment. To select traces for an experiment select the newly create experiment and click the right mouse button. Select Select Traces... from the context sensitive menu.
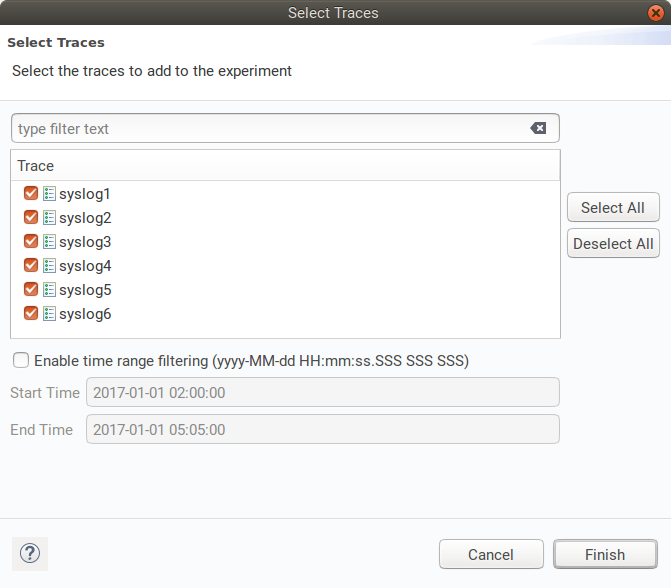
A new dialog box will open with a list of available traces. Select the traces to add from the list and then click on Finish.
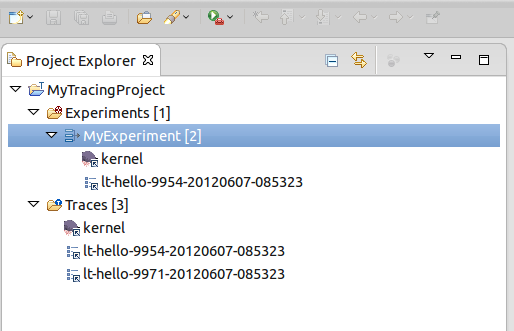
Now the selected traces will be linked to the experiment and will be shown under the Experiments folder.
Alternatively, traces can be added to an experiment using Drag and Drop.
Removing Traces from an Experiment
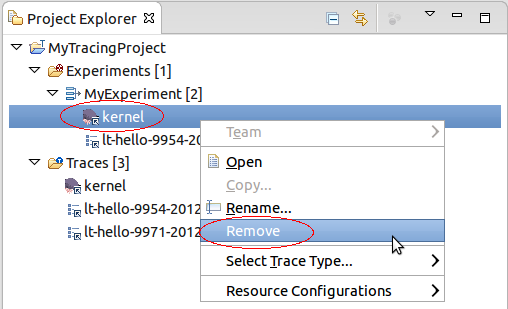
To remove one or more traces for an experiment select the trace(s) to remove under the Experiment folder and click the right mouse button. Select Remove from the context sensitive menu.
After that the selected trace(s) are removed from the experiment. Note that the traces are still in the Traces folder.
Renaming a Trace or Experiment
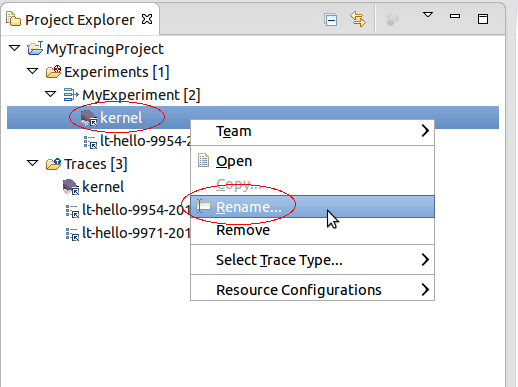
Traces and Experiment can be renamed from the Project Explorer view. To rename a trace or experiment select the relevant trace and click the right mouse button. Then select Rename... from the context sensitive menu.
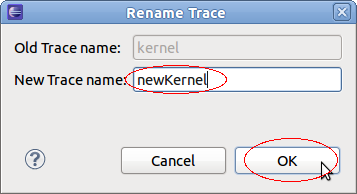
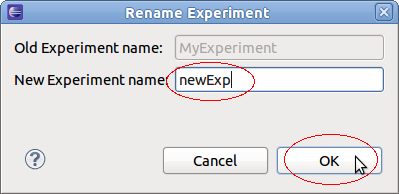
A new dialog box will show for entering a new name. Enter a new trace or experiment name respectively in the relevant text field and click on OK. If the new name already exists the dialog box will show an error and a different name has to be entered.
After successful renaming the new name will show in the Project Explorer. In case of a trace all reference links to that trace will be updated too. Note that linked traces only changes the display name, the underlying trace resource will stay the original name.
Note that all supplementary files will be also handled accordingly (see also Deleting Supplementary Files).
Copying a Trace or Experiment
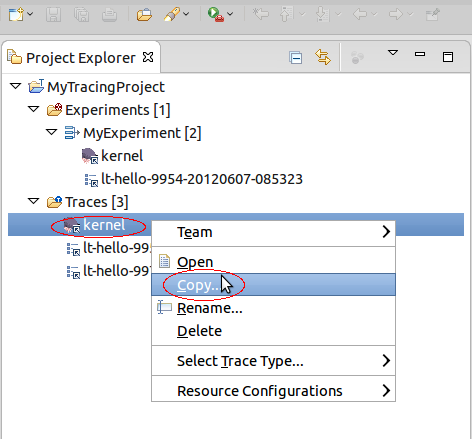
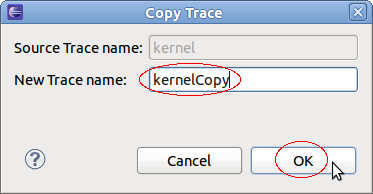
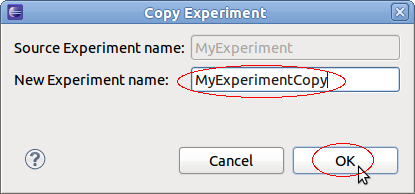
To copy a trace or experiment select the relevant trace or experiment in the Project Explorer view and click the right mouse button. Then select Copy... from the context sensitive menu.
A new dialog box will show for entering a new name. Enter a new trace or experiment name respectively in the relevant text field and click on OK. If the new name already exists the dialog box will show an error and a different name has to be entered.
After successful copy operation the new trace or experiment respectively will show in the Project Explorer. In case of a linked trace, the copied trace will be a link to the original trace too.
Note that the directory for all supplementary files will be copied, too. (see also Deleting Supplementary Files).
Deleting a Trace or Experiment
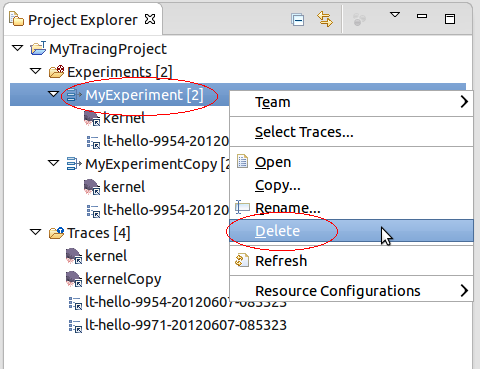
To delete a trace or experiment select the relevant trace or experiment in the Project Explorer view and click the right mouse button. Then select Delete... from the context sensitive menu.
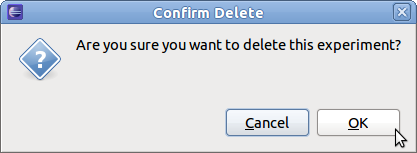
A confirmation dialog box will open. To perform the deletion press OK otherwise select Cancel.
After successful operation the selected trace or experiment will be removed from the project. In case of a linked trace only the link will be removed. The actual trace resource remain on the disk.
Note that the directory for all supplementary files will be deleted, too. (see also Deleting Supplementary Files).
Deleting Supplementary Files
Supplementary files are by definition trace specific files that accompany a trace. These file could be temporary files, persistent indexes or any other persistent data files created by the LTTng integration in Eclipse during parsing a trace. For the LTTng 2.0 trace viewer a persistent state history of the Linux Kernel is created and is stored under the name stateHistroy.ht.
All supplementary file are hidden from the user and are handled internally by the TMF. However, there is a possibility to delete the supplementary files so that there are recreated when opening a trace.
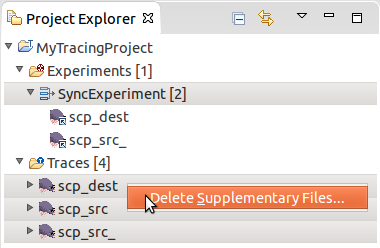
To delete all supplementary files from a single trace, select the relevant trace in the Project Explorer view and click the right mouse button. Then select the Delete Supplementary Files... menu item from the context-sensitive menu.
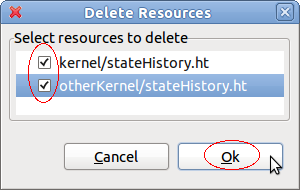
A new dialog box will open with a list of supplementary files. Select the file(s) to delete from the list and press OK.
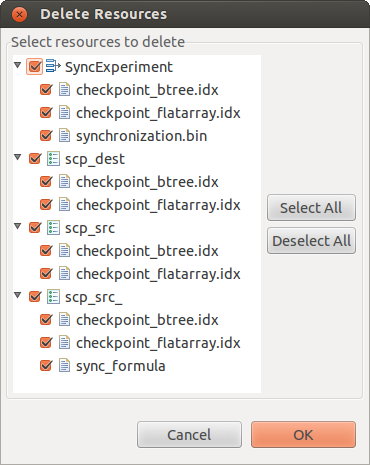
To delete all supplementary files from all traces of a experiment, select the relevant experiment in the Project Explorer view and click the right mouse button. In the context-sensitive menu select Delete Supplementary Files... menu item.
A new dialog box will open with a list of supplementary files. Note that the supplementary files are prefixed with the trace name to indicate the trace they belong to. Select the file(s) to delete from the list and press OK.
Opening a Trace or Experiment
A trace or experiment can be open by double-clicking the left mouse button on the trace or experiment in the Project Explorer view. Alternatively, select the trace or experiment in the in the Project Explorer view and click the right mouse button. Then select Open menu item of the context-sensitive menu.
When opening a trace or experiment all currently open view will be filled which are defined for the corresponding trace type. Additionally, an internal index will be created for fast navigation within a trace. For LTTng 2.0 kernel traces a persistent state history will also be build. This state history will be used in different views to display kernel state information.
Drag and Drop
Traces can be also be imported to a project by dragging from another tracing project and dropping to the project's trace folder. The trace will be copied and the trace type will be set.
Any resource can be dragged and dropped from a non-tracing project, and any file or folder can be dragged from an external tool, into a tracing project's trace folder. The resource will be copied or imported as a new trace, however the trace type will be unknown and need to be set manually by the user.
It is also possible to drop a trace, resource, file or folder into an existing experiment. If the item does not already exist as a trace in the project's trace folder, it will first be copied or imported, then the trace will be added to the experiment.
Events View
The Events view shows the basic trace data in chronological order in a tabular format.
When opened, the Events view displays the events of the currently selected trace or experiment.
The header displays the current trace (or experiment) name.
Being part of the Tracing and Monitoring Framework, the default table displays the following fields:
- Timestamp: the event timestamp
- Source: the source of the event
- Type: the event type and localization
- Reference the event reference
- Content: the raw event content
The first row of the table is the header row a.k.a. the Search and Filter row.
The highlighted event is the current event and is synchronized with the other views. If you select another event, the other views will be synchronized accordingly.
Searching and Filtering
Searching and filtering of events in the table can be performed by entering matching conditions in one or multiple columns in the header row (the first row below the column header).
To toggle between searching and filtering, click on the 'search' (![]() ) or 'filter' (
) or 'filter' (![]() ) icon in the header row's left margin, or right-click on the header row and select Show Filter Bar or Show Search Bar in the context menu.
) icon in the header row's left margin, or right-click on the header row and select Show Filter Bar or Show Search Bar in the context menu.
To apply a matching condition to a specific column, click on the column's header row cell, type in a regular expression and press the ENTER key. You can also enter a simple text string and it will be automatically be replaced with a 'contains' regular expression.
When matching conditions are applied to two or more columns, all conditions must be met for the event to match (i.e. 'and' behavior).
To clear all matching conditions in the header row, press the DEL key.
Searching
When a searching condition is applied to the header row, the table will select the next matching event starting from the top currently displayed event. Wrapping will occur if there is no match until the end of the trace.
All matching events will have a 'search match' icon in their left margin. Non-matching events will be dimmed.
Pressing the ENTER key will search and select the next matching event. Pressing the SHIFT-ENTER key will search and select the previous matching event. Wrapping will occur in both directions.
Press ESC to cancel an ongoing search.
Press DEL to clear the header row and reset all events to normal.
Filtering
When a filtering condition is entered in the head row, the table will clear all events and fill itself with matching events as they are found from the beginning of the trace.
A status row will be displayed before and after the matching events, dynamically showing how many matching events were found and how many events were processed so far. Once the filtering is completed, the status row icon in the left margin will change from a 'stop' to a 'filter' icon.
Press ESC to stop an ongoing filtering. In this case the status row icon will remain as a 'stop' icon to indicate that not all events were processed.
Press DEL or right-click on the table and select Clear Filters from the context menu to clear the header row and remove the filtering. All trace events will be now shown in the table. Note that the currently selected event will remain selected even after the filter is removed.
You can also search on the subset of filtered events by toggling the header row to the Search Bar while a filter is applied. Searching and filtering conditions are independent of each other.
Bookmarking
Any event of interest can be tagged with a bookmark.
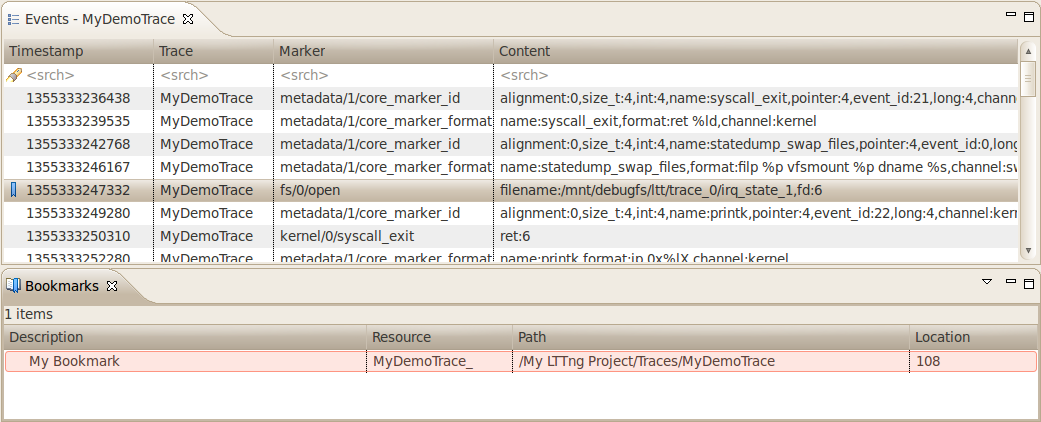
To add a bookmark, double-click the left margin next to an event, or right-click the margin and select Add bookmark.... Alternatively use the Edit > Add bookmark... menu. Edit the bookmark description as desired and press OK.
The bookmark will be displayed in the left margin, and hovering the mouse over the bookmark icon will display the description in a tooltip.
The bookmark will be added to the Bookmarks view. In this view the bookmark description can be edited, and the bookmark can be deleted. Double-clicking the bookmark or selecting Go to from its context menu will open the trace or experiment and go directly to the event that was bookmarked.
To remove a bookmark, double-click its icon, select Remove Bookmark from the left margin context menu, or select Delete from the Bookmarks view.
Histogram View
The Histogram View displays the trace events distribution with respect to time. When streaming a trace, this view is dynamically updated as the events are received.
On the top left, there are two data controls:
- Current Event (sec): Displays the timestamp of the currently selected event
- Window Span (sec): Displays the current time range window size
Both control can be used to modify their respective value. After validation, the other controls and views will be synchronized and updated accordingly.
The large histogram, at the bottom, shows the event distribution over the whole trace or set of traces. It also has a smaller semi-transparent window, with a cross-hair, that shows the currently selected time range window. The time range window can be zoomed in/out by using the mouse wheel. It can also be selected by the mouse and dragged to another region of the trace.
The smaller histogram, on top right, corresponds to the currently selected time range window, a sub-range of the event set. Its size can also be zoomed in/out using the mouse wheel.
The x-axis of each histogram corresponds to the events timestamps. The timestamp of the first and the last event of the respective ranges is displayed. The y-axis of each histogram shows the minimum/maximum number of events in the corresponding histogram bars.
The dashed vertical magenta bar, on the right, shows the position of the last event. The dashed vertical red bar shows the relative position of the currently selected event. The current event can be changed by clicking on the histogram.
Hovering the mouse over an histogram bar pops up an information window that displays the start/end time of the corresponding bar as well as the number of events it represents.
In each histogram, the following keys are handled:
- Left: Moves the current event to the previous non-empty bar
- Right: Moves the current event to the next non-empty bar
- Home: Displays the current event to the first histogram bar
- End: Displays the current event to the last non-empty histogram bar
Statistics View
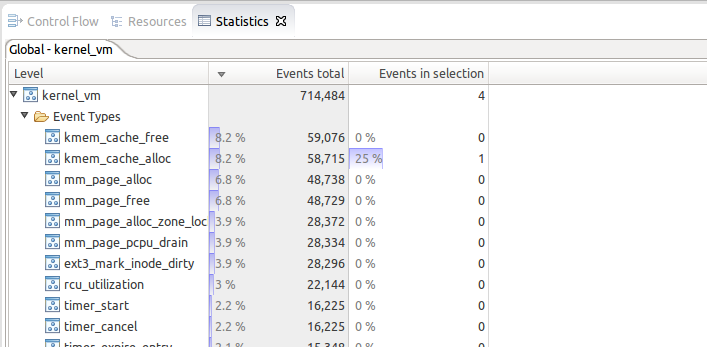
The Statistics View displays the various event counters that are collected when analyzing a trace. The data is organized per trace. To open the Statistics View, select Windows -> Show View -> Other... -> Tracing -> Statistics. A new view will open with the name Statistics. This view shows 2 columns: Level and Number of Events. After parsing a trace the view will display the number of events per event type. The cells where the number of events are printed also contain a colored bar that indicates the percentage of the event count in relation to the total number of events. The statistics is collected for the whole trace. This view is part of the Tracing and Monitoring Framework (TMF) and is generic. It will work for any trace type extensions. For the LTTng 2.0 integration the Statistics view will display statistics as shown below.:
Colors View
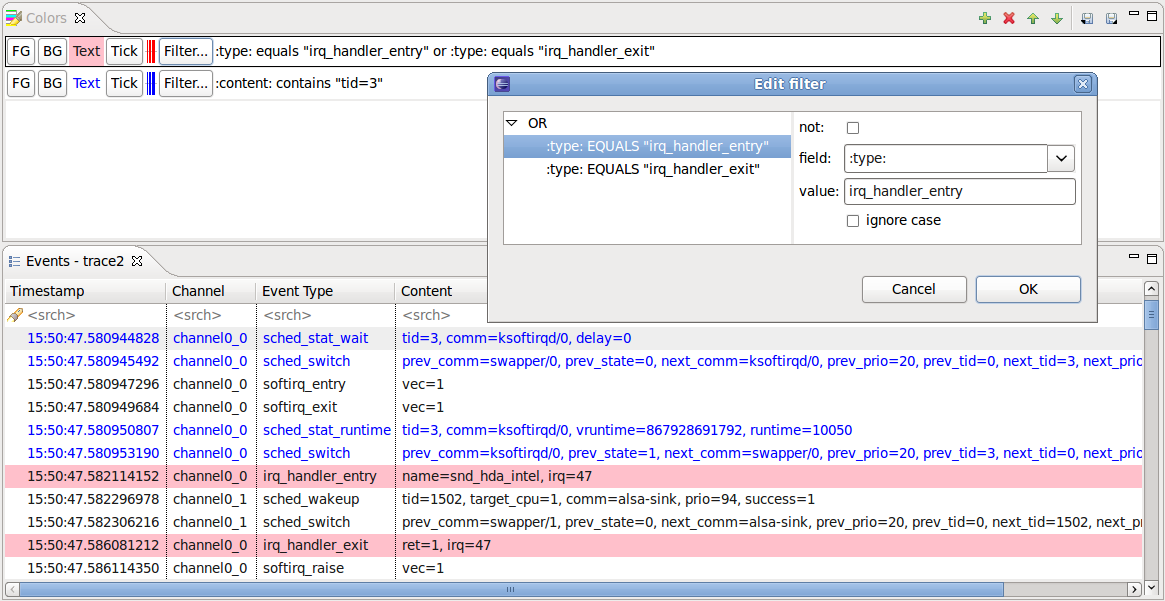
The Colors view allows the user to define a prioritized list of color settings.
A color setting associates a foreground and background color (used in any events table), and a tick color (used in the Time Chart view), with an event filter.
In an events table, any event row that matches the event filter of a color setting will be displayed with the specified foreground and background colors. If the event matches multiple filters, the color setting with the highest priority will be used.
The same principle applies to the event tick colors in the Time Chart view. If a tick represents many events, the tick color of the highest priority matching event will be used.
Color settings can be inserted, deleted, reordered, imported and exported using the buttons in the Colors view toolbar. Changes to the color settings are applied immediately, and are persisted to disk.
Filters View
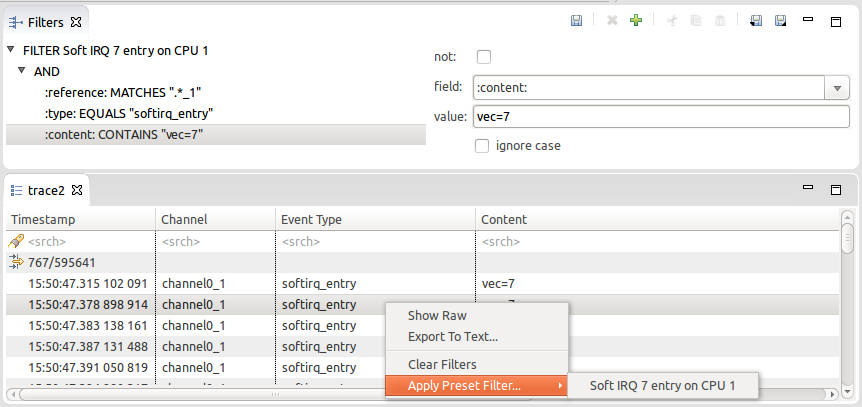
The Filters view allows the user to define preset filters that can be applied to any events table.
The filters can be more complex than what can be achieved with the filter header row in the events table. The filter is defined in a tree node structure, where the node types can be any of EVENTTYPE, AND, OR, CONTAINS, EQUALS, MATCHES or COMPARE. Some nodes types have restrictions on their possible children in the tree.
The EVENTTYPE node filters against the event type of the trace as defined in a plugin extension or in a custom parsers. When used, any child node will have its field combo box restricted to the possible fields of that event type.
The AND node applies the logical and condition on all of its children. All children conditions must be true for the filter to match. A not operator can be applied to invert the condition.
The OR node applies the logical or condition on all of its children. At least one children condition must be true for the filter to match. A not operator can be applied to invert the condition.
The CONTAINS node matches when the specified event field value contains the specified value string. A not operator can be applied to invert the condition. The condition can be case sensitive or insensitive.
The EQUALS node matches when the specified event field value equals exactly the specified value string. A not operator can be applied to invert the condition. The condition can be case sensitive or insensitive.
The MATCHES node matches when the specified event field value matches against the specified regular expression. A not operator can be applied to invert the condition.
The COMPARE node matches when the specified event field value compared with the specified value gives the specified result. The result can be set to smaller than, equal or greater than. The type of comparison can be numerical, alphanumerical or based on time stamp. A not operator can be applied to invert the condition.
Filters can be added, deleted, imported and exported using the buttons in the Filters view toolbar. Changes to the preset filters are only applied and persisted to disk when the save filters button is pressed.
To apply a saved preset filter in an events table, right-click on the table and select Apply preset filter... > filter name.
Time Chart View
The Time Chart view allows the user to visualize every open trace in a common time chart. Each trace is display in its own row and ticks are display for every punctual event. As the user zooms using the mouse wheel or by right-clicking and dragging in the time scale, more detailed event data is computed from the traces.
Time synchronization is enabled between the time chart view and other trace viewers such as the events table.
Color settings defined in the Colors view can be used to change the tick color of events displayed in the Time Chart view.
When a search is applied in the events table, the ticks corresponding to matching events in the Time Chart view are decorated with a marker below the tick.
When a bookmark is applied in the events table, the ticks corresponding to the bookmarked event in the Time Chart view is decorated with a bookmark above the tick.
When a filter is applied in the events table, the non-matching ticks are removed from the Time Chart view.
The Time Chart only supports traces that are opened in an editor. The use of an editor is specified in the plugin extension for that trace type, or is enabled by default for custom traces.
Environment Variables View
A new feature of CTF traces is their ability to store user defined data that is not to be placed in an event. It is generally data that is per-trace specific, such as the tracer version and the trace domain. It will be populated when a trace is loaded if the trace has environment variables.
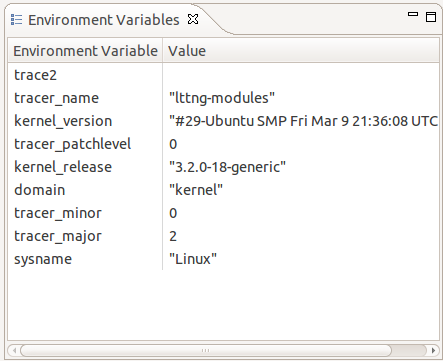
The above picture shows a trace loaded that was collevcted with the lttng-modules version 2.0.0 tracer. It is a kernel trace of the 3.2.0-18-generic linux kernel.
Custom Parser
Custom parser wizards allow the user to define their own parsers for text or XML traces. The user defines how the input should be parsed into internal trace events and identifies the event fields that should be created and displayed. Traces created using a custom parser can be correlated with other built-in traces or traces added by plug-in extension.
Creating a custom text parser
The New Custom Text Parser wizard can be used to create a custom parser for text logs. It can be launched several ways:
- Select File > New > Other... > Tracing > Custom Text Parser
- Open the Manage Custom Parsers dialog from the Project Explorer view menu, select the Text radio button and click the New... button
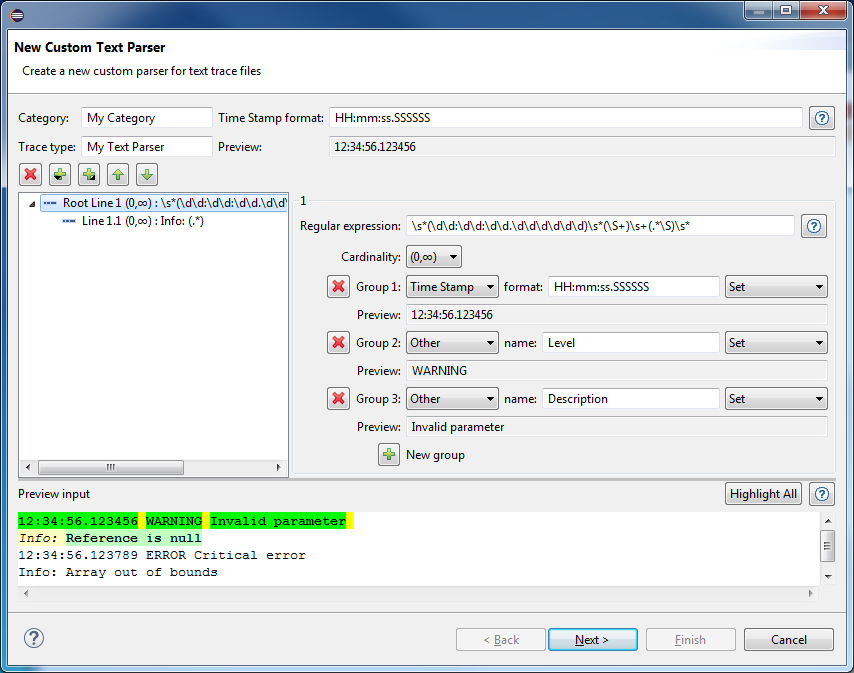
Fill out the first wizard page with the following information:
- Log type: Enter a name for the custom log entries, which is also the name of the custom parser.
- Time Stamp format: Enter the date and time pattern that will be used to output the Time Stamp.
Note: information about date and time patterns can be found here: [2]
Click the Add next line, Add child line or Remove line buttons to create a new line of input or delete it. For each line of input, enter the following information:
- Regular expression: Enter a regular expression that should match the input line in the log, using capturing groups to extract the data.
Note: information about date and time patterns can be found here: [3]
- Cardinality: Enter the minimum and maximum number of lines matching this line's regular expression that must be found in the log. At least the minimum number of lines must be found before the parser will consider the next line. Child lines will always be considered first.
Important note: The custom parsers identify a log entry when the first line's regular expression matches (Root Line n). Each subsequent text line in the log is attempted to be matched against the regular expression of the parser's input lines in the order that they are defined (Line n.*). Only the first matching input line will be used to process the captured data to be stored in the log entry. When a text line matches a Root Line's regular expression, a new log entry is started.
Click the Add group or Remove group buttons to define the data extracted from the capturing groups in the line's regular expression. For each group, enter the following information:
- Name combo: Select a name for the extracted data:
- Time Stamp: Select this option to identify the time stamp data. The input's data and time pattern must be entered in the format: text box.
- Message: Select this option to identify the main log entry's message. This is usually a group which could have text of greater length.
- Other: Select this option to identify any non-standard data. The name must be entered in the name: text box.
- Action combo: Select the action to be performed on the extracted data:
- Set: Select this option to overwrite the data for the chosen name when there is a match for this group.
- Append: Select this option to append to the data with the chosen name, if any, when there is a match for this group.
- Append with | : Select this option to append to the data with the chosen name, if any, when there is a match for this group, using a | separator between matches.
The Preview input text box can be used to enter any log data that will be processed against the defined custom parser. When the wizard is invoked from a selected log file resource, this input will be automatically filled with the file contents.
The Preview: text field of each capturing group and of the Time Stamp will be filled from the parsed data of the first matching log entry.
In the Preview input text box, the matching entries are highlighted with different colors:
-
Yellow: indicates uncaptured text in a matching line. -
Green: indicates a captured group in the matching line's regular expression for which a custom parser group is defined. This data will be stored by the custom parser. -
Magenta: indicates a captured group in the matching line's regular expression for which there is no custom parser group defined. This data will be lost. -
White: indicates a non-matching line.
The first line of a matching entry is highlighted with darker colors.
By default only the first matching entry will be highlighted. To highlight all matching entries in the preview input data, click the Highlight All button. This might take a few seconds to process, depending on the input size.
Click the Next button to go to the second page of the wizard.
On this page, the list of default and custom data is shown, along with a preview of the custom parser log table output.
The custom data output can be modified by the following options:
- Visibility: Select or unselect the checkbox to display the custom data or hide it.
- Column order: Click Move before or Move after to change the display order of custom data.
The table at the bottom of the page shows a preview of the custom parser log table output according to the selected options, using the matching entries of the previous page's Preview input log data.
Click the Finish button to close the wizard and save the custom parser.
Creating a custom XML parser
The New Custom XML Parser wizard can be used to create a custom parser for XML logs. It can be launched several ways:
- Select File > New > Other... > Tracing > Custom XML Parser
- Open the Manage Custom Parsers dialog from the Project Explorer view menu, select the XML radio button and click the New... button
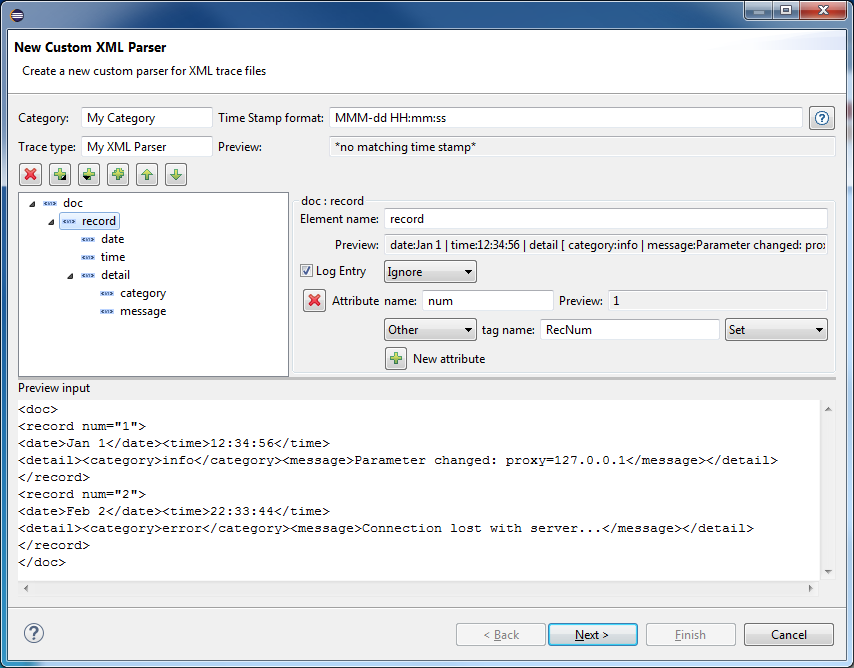
Fill out the first wizard page with the following information:
- Log type: Enter a name for the custom log entries, which is also the name of the custom parser.
- Time Stamp format: Enter the date and time pattern that will be used to output the Time Stamp.
Note: information about date and time patterns can be found here: [4]
Click the Add document element button to create a new document element and enter a name for the root-level document element of the XML file.
Click the Add child button to create a new element of input to the document element or any other element. For each element, enter the following information:
- Element name: Enter a name for the element that must match an element of the XML file.
- Log entry: Select this checkbox to identify an element which represents a log entry. Each element with this name in the XML file will be parsed to a new log entry. At least one log entry element must be identified in the XML document. Log entry elements cannot be nested.
- Name combo: Select a name for the extracted data:
- Ignore: Select this option to ignore the extracted element's data at this level. It is still possible to extract data from this element's child elements.
- Time Stamp: Select this option to identify the time stamp data. The input's data and time pattern must be entered in the format: text box.
- Message: Select this option to identify the main log entry's message. This is usually an input which could have text of greater length.
- Other: Select this option to identify any non-standard data. The name must be entered in the name: text box. It does not have to match the element name.
- Action combo: Select the action to be performed on the extracted data:
- Set: Select this option to overwrite the data for the chosen name when there is a match for this element.
- Append: Select this option to append to the data with the chosen name, if any, when there is a match for this element.
- Append with | : Select this option to append to the data with the chosen name, if any, when there is a match for this element, using a | separator between matches.
Note: An element's extracted data 'value' is a parsed string representation of all its attributes, children elements and their own values. To extract more specific information from an element, ignore its data value and extract the data from one or many of its attributes and children elements.
Click the Add attribute button to create a new attribute input from the document element or any other element. For each attribute, enter the following information:
- Attribute name: Enter a name for the attribute that must match an attribute of this element in the XML file.
- Name combo: Select a name for the extracted data:
- Time Stamp: Select this option to identify the time stamp data. The input's data and time pattern must be entered in the format: text box.
- Message: Select this option to identify the main log entry's message. This is usually an input which could have text of greater length.
- Other: Select this option to identify any non-standard data. The name must be entered in the name: text box. It does not have to match the element name.
- Action combo: Select the action to be performed on the extracted data:
- Set: Select this option to overwrite the data for the chosen name when there is a match for this element.
- Append: Select this option to append to the data with the chosen name, if any, when there is a match for this element.
- Append with | : Select this option to append to the data with the chosen name, if any, when there is a match for this element, using a | separator between matches.
Note: A log entry can inherited input data from its parent elements if the data is extracted at a higher level.
Click the Feeling lucky button to automatically and recursively create child elements and attributes for the current element, according to the XML element data found in the Preview input text box, if any.
Click the Remove element or Remove attribute buttons to remove the extraction of this input data. Take note that all children elements and attributes are also removed.
The Preview input text box can be used to enter any XML log data that will be processed against the defined custom parser. When the wizard is invoked from a selected log file resource, this input will be automatically filled with the file contents.
The Preview: text field of each capturing element and attribute and of the Time Stamp will be filled from the parsed data of the first matching log entry. Also, when creating a new child element or attribute, its element or attribute name will be suggested if possible from the preview input data.
Click the Next button to go to the second page of the wizard.
On this page, the list of default and custom data is shown, along with a preview of the custom parser log table output.
The custom data output can be modified by the following options:
- Visibility: Select or unselect the checkbox to display the custom data or hide it.
- Column order: Click Move before or Move before to change the display order of custom data.
The table at the bottom of the page shows a preview of the custom parser log table output according to the selected options, using the matching entries of the previous page's Preview input log data.
Click the Finish button to close the wizard and save the custom parser.
Managing custom parsers
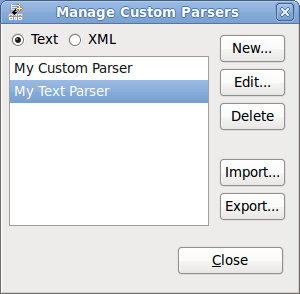
The Manage Custom Parsers dialog is used to manage the list of custom parsers used by the tool. To open the dialog:
- Select Manage Custom Parsers from the Project Explorer view menu.
The ordered list of currently defined custom parsers for the selected type is displayed on the left side of the dialog.
To change the type of custom parser to manage, select the Text or XML radio button.
The following actions can be performed from this dialog:
- New...
Click the New... button to launch the New Custom Parser wizard.
- Edit...
Select a custom parser from the list and click the Edit... button to launch the Edit Custom Parser wizard.
- Delete
Select a custom parser from the list and click the Delete button to remove the custom parser.
- Import...
Click the Import... button and select a file from the opened file dialog to import all its custom parsers.
- Export...
Select a custom parser from the list, click the Export... button and enter or select a file in the opened file dialog to export the custom parser. Note that if an existing file containing custom parsers is selected, the custom parser will be appended to the file.
Opening a trace using a custom parser
Once a custom parser has been created, any imported trace file can be opened and parsed using it.
To do so:
- Select a trace in the Project Explorer view
- Right-click the trace and select Select Trace Type... > Custom Text or Custom XML > parser name
- Double-click the trace or right-click it and select Open
The trace will be opened in an editor showing the events table, and an entry will be added for it in the Time Chart view.
LTTng Tracer Control
The LTTng Tracer Control in Eclipse for the LTTng Tracer toolchain version v2.0 (or later) is done using SSH and requires an SSH server to be running on the remote host. For the SSH connection the SSH implementation of RSE is used. For that a new System Type was defined using the corresponding RSE extension. The functions to control the LTTng tracer (e.g. start and stop), either locally or remotely, are available from a dedicated Control View.
In the following sections the LTTng 2.0 tracer control integration in Eclipse is described. Please refer to the LTTng 2.0 tracer control command line manual for more details and descriptions about all commands and their command line parameters References.
Control View
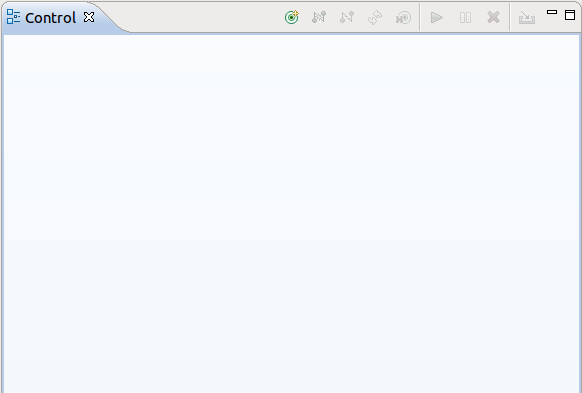
To open the Control View, select 'Window->Show View->Other...->LTTng->Control View.
Creating a New Connection to a Remote Host
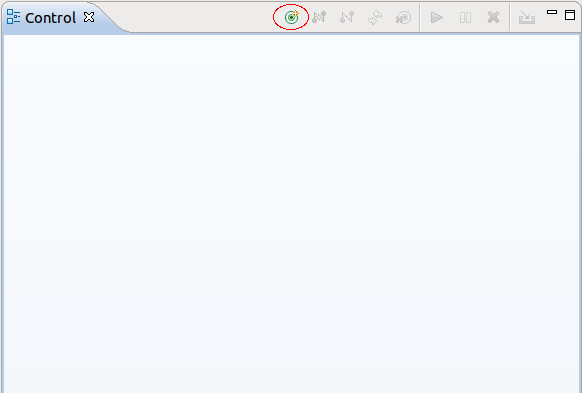
To connect to a remote host, select the New Connection button in the Control View.
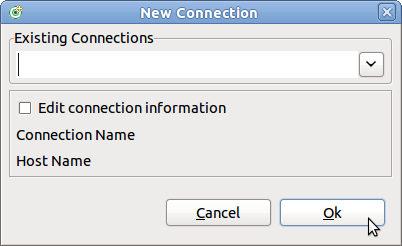
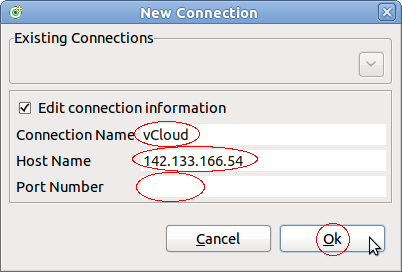
A new display will show for entering the remote host information. A drop down menu will filled with all existing host information which were used before. To enter the host information either select one of the hosts in the drop down menu or enter the host information manually.
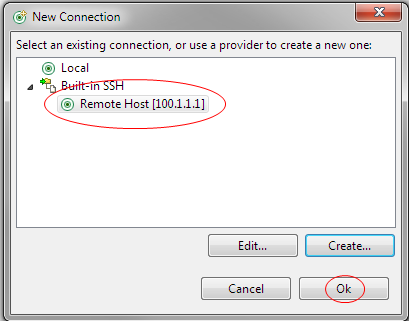
To use an existing connection definition, select the relevant entry in the drop-down menu and then select Ok.
To enter the host information manually select first the button Edit connection information. Then the text fields Connection Name and Host Name will enabled. Enter the relevant information and then select Ok.
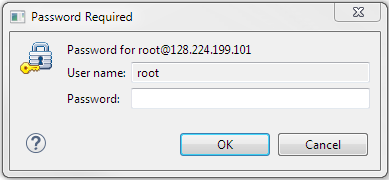
A new display will show for providing the user name and password. This display only opens if no password had been saved before. Enter user name and password in the Enter Password dialog box and select Ok.
The Host Name holds the IP address or DNS name of the remote system. The Connection Name is the alias name to be displayed in the Control View.
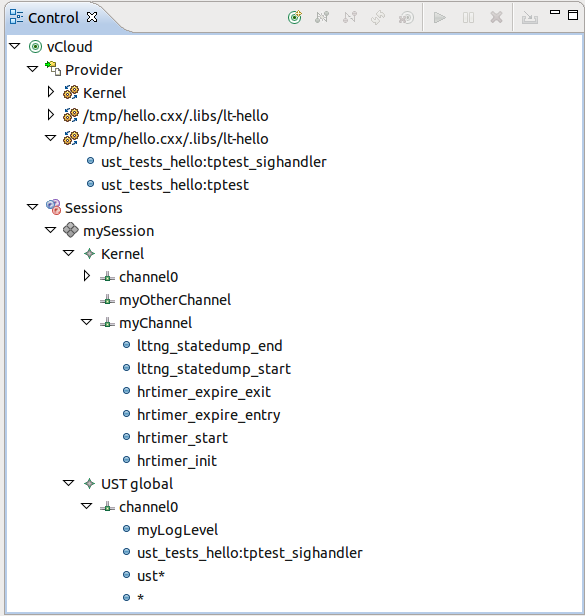
After pressing Ok the SSH connection will be established and after successful login the Control View implementation retrieves the LTTng Tracer Control information. This information will be displayed in the Control View in form of a tree structure.
The top level tree node is the representation of the remote connection (host). The connection name of the connection will be displayed. Depending on the connection state different icons are displayed. If the node is CONNECTED the icon is shown ![]() , otherwise (states CONNECTING, DISCONNNECTING or DISCONNECTED the icon is
, otherwise (states CONNECTING, DISCONNNECTING or DISCONNECTED the icon is ![]() .
.
Under the host level two folder groups are located. The first one is the Provider group. The second one is the Sessions group.
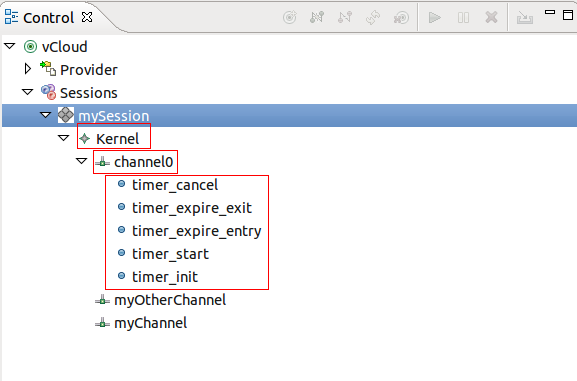
Under the Provider group all trace providers are displayed. Trace providers are Kernel and any user space application that supports UST tracing. Under each provider a corresponding list of events are displayed.
Under the Sessions group all current sessions will be shown. The level under the sessions show the configured domains. Currently the LTTng 2.0 Tracer Toolchan supports domain Kernel and UST global. Under each domain the configured channels will be displayed. The last level is under the channels where the configured events are displayed.
Each session can be ACTIVE or INACTIVE. Active means that tracing has been started, inactive means that the tracing has been stopped. Depending on the state of a session a different icon is displayed. The icon for an active session is ![]() . The icon for an inactive session is
. The icon for an inactive session is ![]() .
.
Each channel can be ENABLED or DISABLED. An enabled channel means that all configured events of that channel will be traced and a disabled channel won't trace any of its configured events. Different icons are displayed depending on the state of the channel. The icon for an enabled channel is ![]() and the icon for a disabled channel is
and the icon for a disabled channel is ![]() .
.
Events within a channel can be in state ENABLED or DISABLED. Enabled events are stored in the trace when passed during program execution. Disabled events on the other hand won't be traced. Depending on the state of the event the icons for the event is different. An enabled event has the icon ![]() and a disabled event the icon
and a disabled event the icon ![]() .
.
Disconnecting from a Remote Host
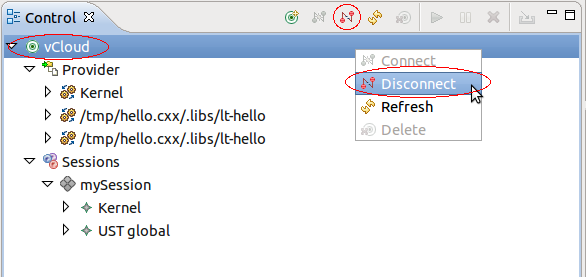
To disconnect from a remote host, select the host in the Control View and press the Disconnect button. Alternatively, press the right mouse button. A context-sensitive menu will show. Select the Disconnect button.
Connecting to a Remote Host
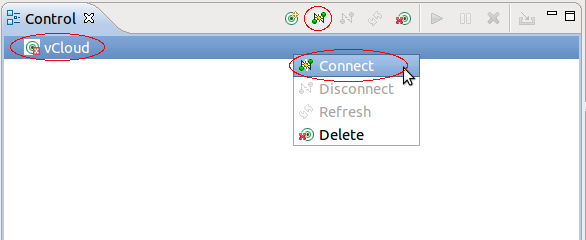
To connect to a remote host, select the host in the Control View and press the Connect button. Alternatively, press the right mouse button. A context-sensitive menu will show. Select the Connect button. This will start the connection process as discribed in Creating a New Connection to a Remote Host.
Deleting to a Remote Host Connection
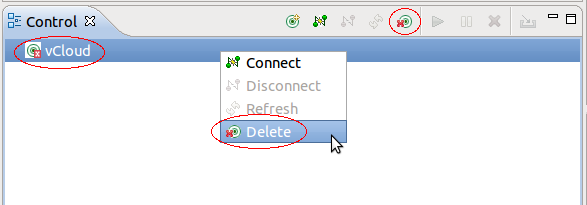
To delete a remote host connection, select the host in the Control View and press the Delete button. Alternatively, press the right mouse button. A context-sensitive menu will show. Select the Delete button. For that command to be active the connection state has to be DISCONNECTED.
Creating a Tracing Session
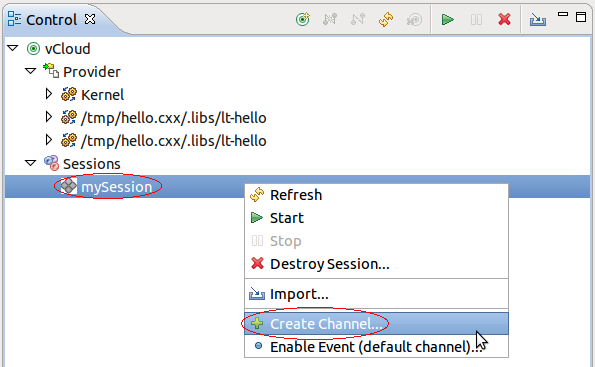
To create a tracing session, select the tree node Sessions and press the right mouse button. Then select the Create Session... button of the context-sensitive menu.
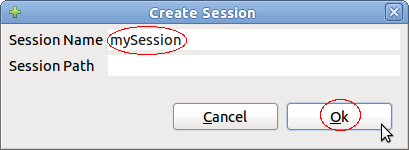
A dialog box will open for entering information about the session to be created.
Fill in the Session Name and optionally the Session Path and press Ok. Upon successful operation a new session will be created and added under the tree node Sessions.
Enabling Channels - General
Enabling channels can be done using a session tree node when the domain hasn't be created in the session or, alternatively on a domain tree node of a session in case the domain is already available.
Enabling Channels On Session Level
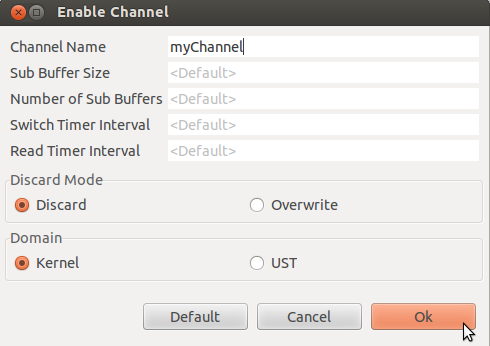
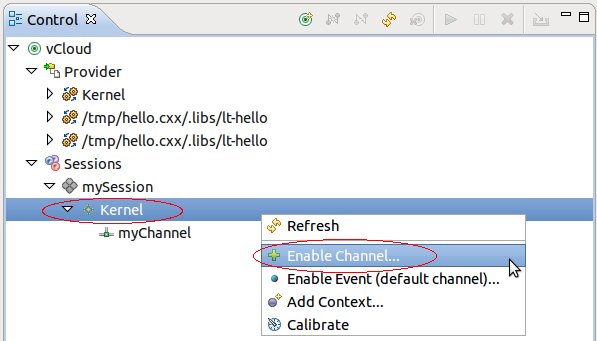
To enable a channel, select the tree node of the relevant session and press the right mouse button. Then select the Enable Channel... button of the context-sensitive menu.
A dialog box will open for entering information about the channel to be created.
By default the domain Kernel is selected and the corresponding default values are shown. To create a UST channel, select UST under the domain section. To get the default values of UST, then press button Default.
If required update the following channel information and then press Ok.
- Channel Name: The name of the channel.
- Number of Sub Buffers: The number of sub-buffers of the channel.
- Overwrite Mode: The channel overwrite mode (true or false)
- Read Timer Interval: The read timer interval.
- Sub Buffer size: The size of the sub-buffers of the channel (in bytes).
- Switch Timer Interval: The switch timer interval.
Upon successful operation, the requested domain will be created under the session tree node as well as the requested channel will be added under the domain. The channel will be ENABLED.
Enabling Channels On Domain Level
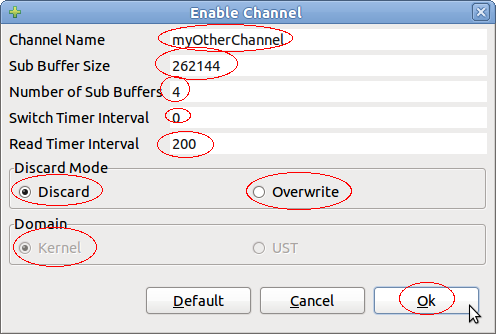
Once a domain is available, channels can be enabled directly using the domain. To enable a channel under an existing domain, select the tree node of the relevant domain and press the right mouse button. Then select the Enable Channel... button of the context-sensitive menu.
The dialog box for enabling channel will open for entering information about the channel to be created. Note that the domain is pre-selected and cannot be changed.
Fill the relevant information and press Ok.
Enabling and Disabling Channels
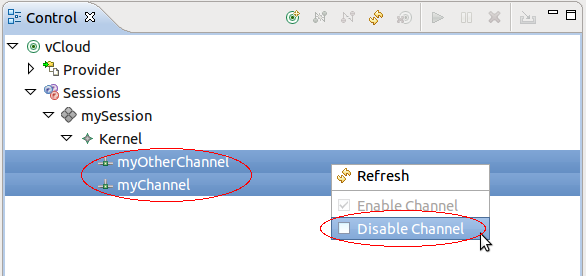
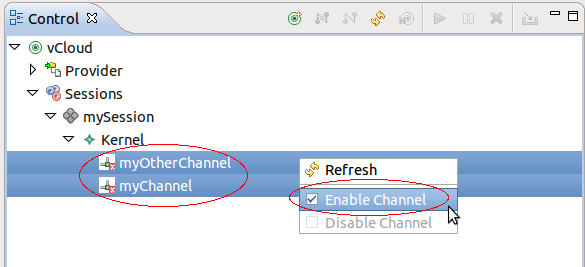
To disable one or more enabled channels, select the tree nodes of the relevant channels and press the right mouse button. Then select the Disable Channel menu item of the context-sensitive menu.
Upon successful operation, the selected channels will be DISABLED and the icons for the channels will be updated.
To enable one or more disabled channels, select the tree nodes of the relevant channels and press the right mouse button. Then select the Enable Channel menu item of the context-sensitive menu.
Upon successful operation, the selected channels will be ENABLED and the icons for the channels will be updated.
Enabling Events - General
Enabling events can be done using different levels in the tree node. It can be done on the session, domain level and channel level. For the case of session or domain, i.e. when no specific channels is assigned then enabling of events is done on the default channel with the name channel0 which created, if not already exists, by the LTTng tracer control on the server side.
Enabling Kernel Events On Session Level
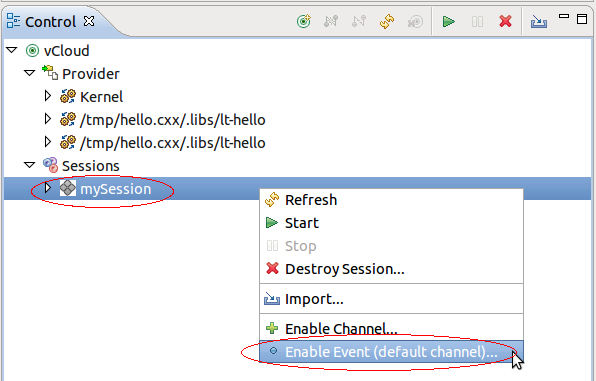
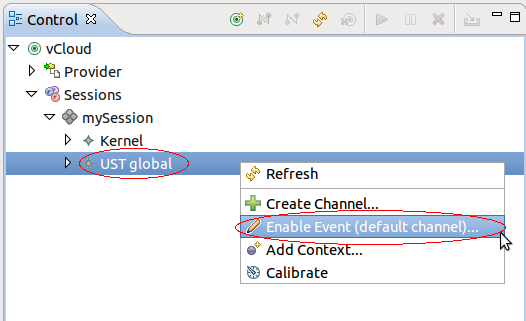
To enable events, select the tree node of the relevant session and press the right mouse button. Then select the Enable Event (default channel)... button of the context-sensitive menu.
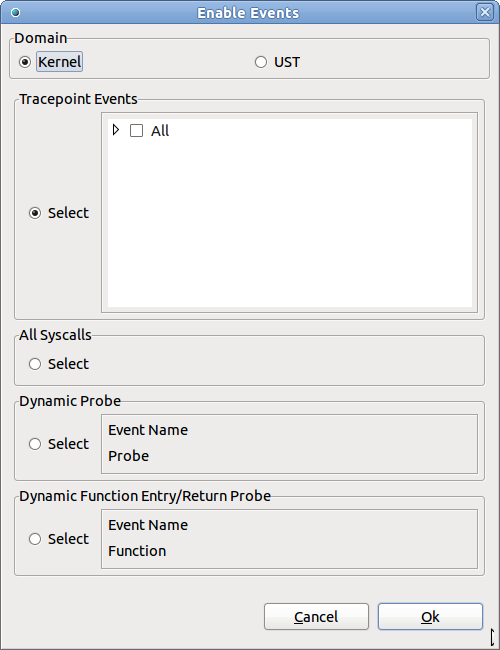
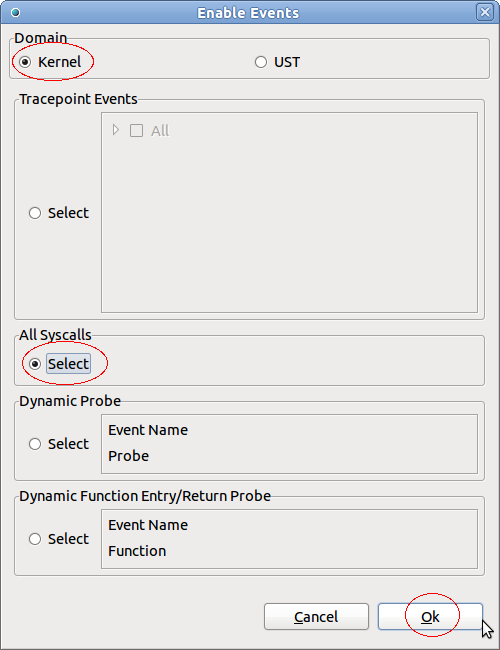
A dialog box will open for entering information about events to be enabled.
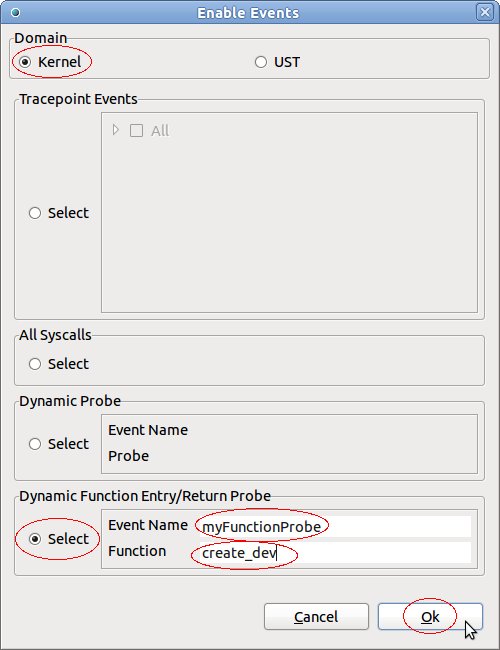
By default the domain Kernel is selected and the kernel specific data sections are created. From this dialog box kernel Tracepoint events, System calls (Syscall), a Dynamic Probe or a Dynamic Function entry/return probe can be enabled. Note that events of one of these types at a time can be enabled.
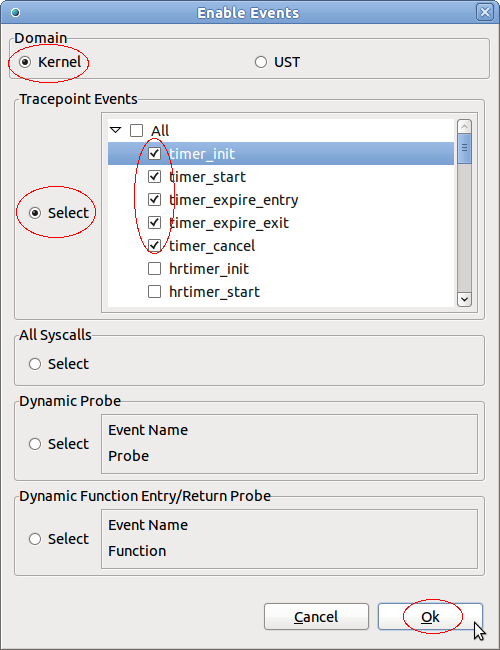
To enable Tracepoint events, first select the corresponding Select button, then select either all tracepoins (select All) or select selectively one or more tracepoints in the displayed tree of tracepoints and finally press Ok.
Upon successful operation, the domain Kernel will be created in the tree (if neccessary), the default channel with name "channel0" will be added under the domain (if necessary) as well as all requested events of type TRACEPOINT under the channel. The channel and events will be ENABLED.
To enable all Syscalls, select the corresponding Select button and press Ok.
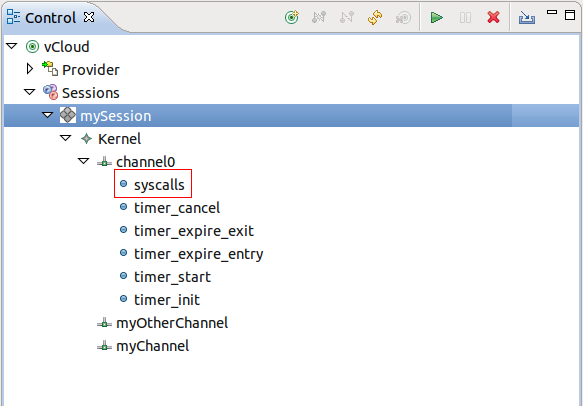
Upon successful operation, the event with the name syscalls and event type SYSCALL will be added under the default channel (channel0). If necessary the domain Kernel and the channel channel0 will be created.
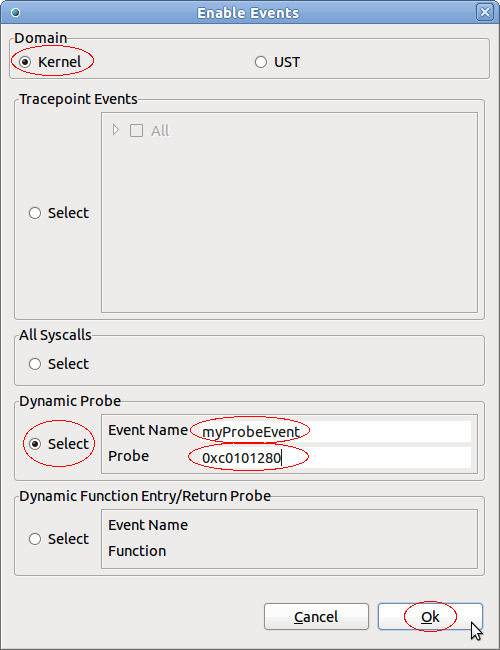
To enable a Dynamic Probe event, select the corresponding Select button, fill the Event Name and Probe fields and press Ok. Note that the probe can be an address, symbol or a symbol+offset where the address and offset can be octal (0NNN...), decimal (NNN...) or hexadecimal (0xNNN...).
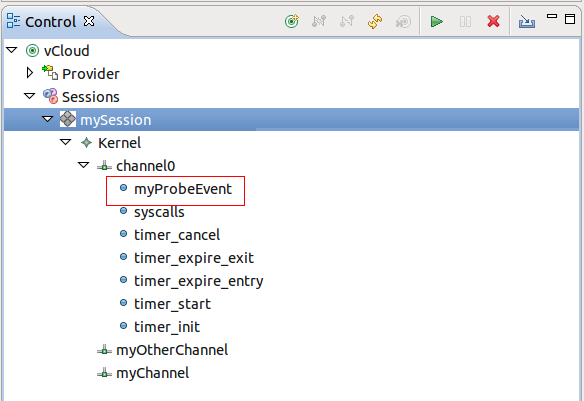
Upon successful operation, the dynamic probe event with the given name and event type PROBE will be added under the default channel (channel0). If necessary the domain Kernel and the channel channel0 will be created.
To enable a Dynamic Function entry/return Probe event, select the corresponding Select button, fill the Event Name and Function fields and press Ok. Note that the funtion probe can be an address, symbol or a symbol+offset where the address and offset can be octal (0NNN...), decimal (NNN...) or hexadecimal (0xNNN...).
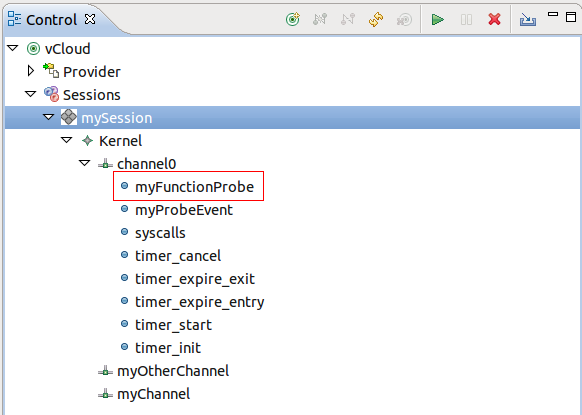
Upon successful operation, the dynamic function probe event with the given name and event type PROBE will be added under the default channel (channel0). If necessary the domain Kernel and the channel channel0 will be created.
Enabling UST Events On Session Level
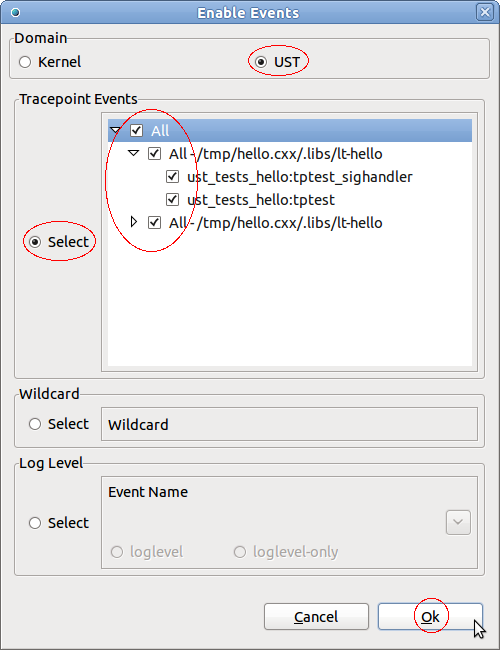
For enabling UST events, first open the enable events dialog as described in section Enabling Kernel Events On Session Level and select domain UST.
To enable Tracepoint events, first select the corresponding Select button, then select either all tracepoins (select All) or select selectively one or more tracepoints in the displayed tree of tracepoints and finally press Ok.
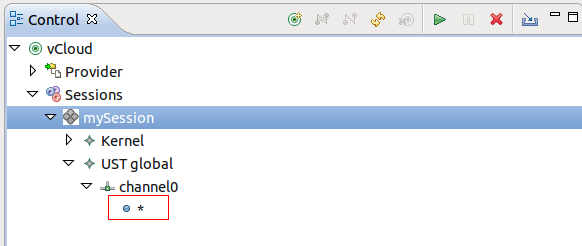
Upon successful operation, the domain UST global will be created in the tree (if neccessary), the default channel with name "channel0" will be added under the domain (if necessary) as well as all requested events under the channel. The channel and events will be ENABLED. Note that for the case that All tracepoints were selected the wildcard * is used which will be shown in the Control View as below.
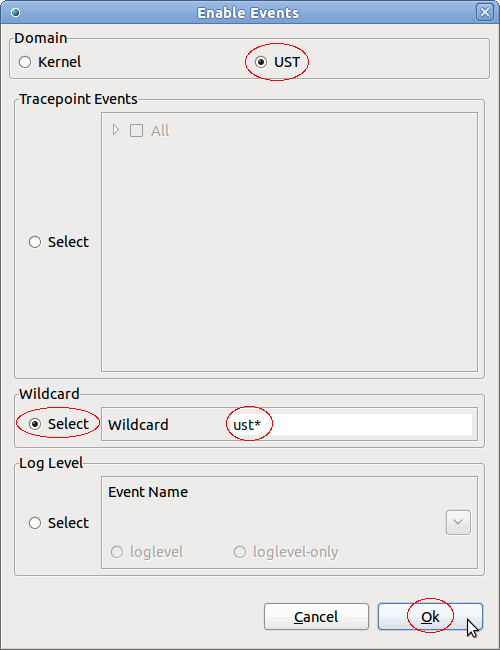
For UST it is possible to enable Tracepoint events using a wildcard. To enable Tracepoint events with a wildcard, select first the corresponding Select button, fill the Wildcard field and press Ok.
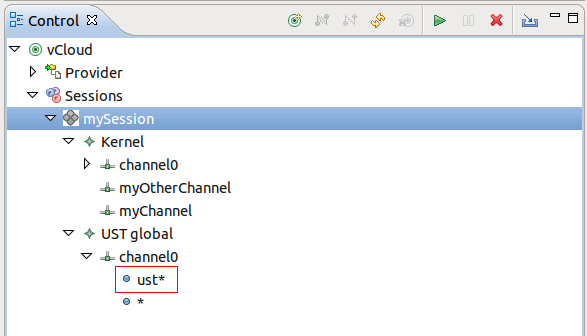
Upon successful operation, the event with the given wildcard and event type TRACEPOINT will be added under the default channel (channel0). If necessary the domain UST global and the channel channel0 will be created.
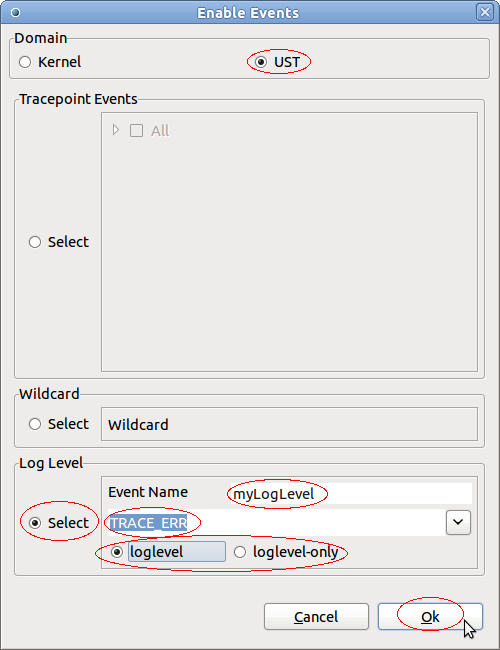
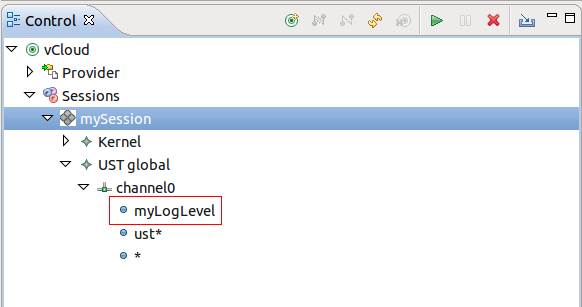
For UST it is possible to enable Tracepoint events using log levels. To enable Tracepoint events using log levels, select first the corresponding Select button, select a log level from the drop down menu, fill in the relevant information (see below) and press Ok.
- Event Name: Name to display
- loglevel: To specify if a range of log levels (0 to selected log level) shall be configured
- loglevel-only: To specify that only the specified log level shall be configured
Upon successful operation, the event with the given event name and event type TRACEPOINT will be added under the default channel (channel0). If necessary the domain UST global and the channel channel0 will be created.
Enabling Events On Domain Level
Kernel events can also be enabled on the domain level. For that select the relevant domain tree node, click the right mouse button and the select Enable Event (default channel).... A new dialog box will open for providing information about the events to be enabled. Depending on the domain, Kernel or UST global, the domain specifc fields are shown and the domain selector is preselected and read-only.
To enable events for domain Kernel follow the instructions in section Enabling Kernel Events On Session Level, for domain UST global Enabling UST Events On Session Level.
When enabling events on the domain level, the events will be add to the default channel channel0. This channel will be created by on the server side if neccessary.
Enabling Events On Channel Level
Kernel events can also be enabled on the channel level. If necessary, create a channel as described in sections Creating Channels On Session Level or Creating Channels On Domain Level.
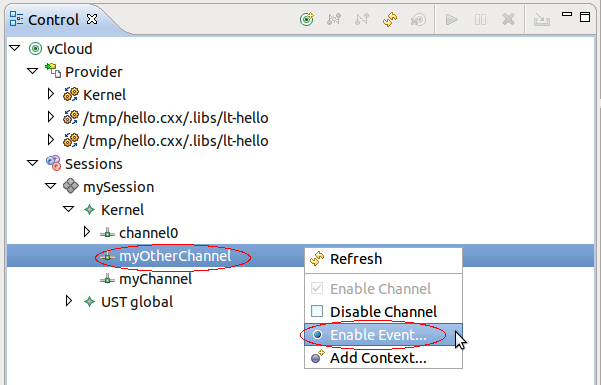
Then select the relevant channel tree node, click the right mouse button and the select Enable Event.... A new dialog box will open for providing information about the events to be enabled. Depending on the domain, Kernel or UST global, the domain specifc fields are shown and the domain selector is preselected and read-only.
To enable events for domain Kernel follow the instructions in section Enabling Kernel Events On Session Level, for domain UST global Enabling UST Events On Session Level.
When enabling events on the channel level, the events will be add to the selected channel.
Enabling and Disabling Events
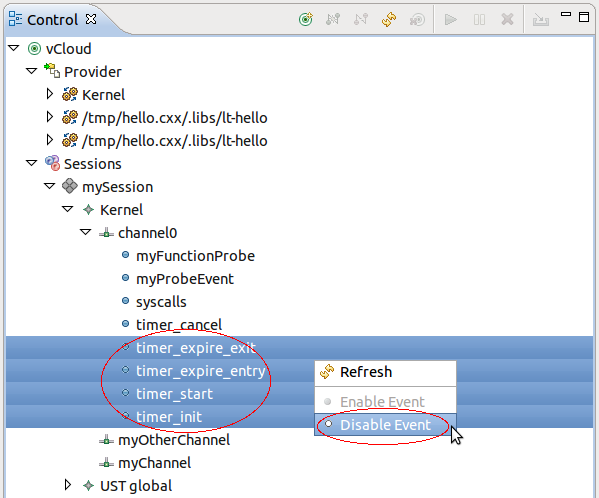
To disable one or more enabled events, select the tree nodes of the relevant events and click the right mouse button. Then select Disable Event menu item in the context-sensitive menu.
Upon successful operation, the selected events will be DISABLED and the icons for these events will be updated.
To enable one or more disabled events, select the tree nodes of the relevant events and press the right mouse button. Then select the Enable Event menu item of the context-sensitive menu.
Upon successful operation, the selected events will be ENABLED and the icons for these events will be updated.
Note: There is currently a limitation for kernel event of type SYSCALL. This kernel event can not be disabled. An error will appear when trying to disable this type of event. A work-around for that is to have the syscall event in a separate channel and disable the channel instead of the event.
Enabling Tracepoint Events From Provider
It is possible to enable events of type Tracepoint directly from the providers and assign the enabled event to a session and channel. Before doing that a session has to be created as described in section Creating a Tracing Session. Also, if other than default channel channel0 is required, create a channel as described in sections Creating Channels On Session Level or Creating Channels On Domain Level.
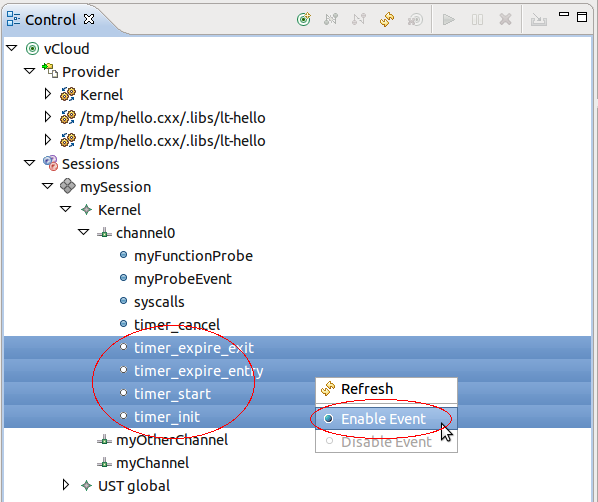
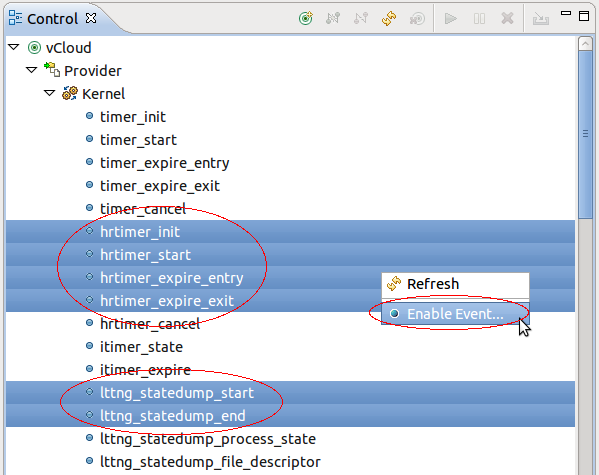
To assign tracepoint events to a session and channel, select the events to be enabled under the provider (e.g. provider Kernel), click right mouse button and then select Enable Event... menu item from the context sensitive menu.
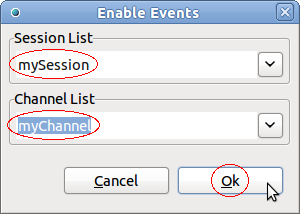
A new display will open for defining the session and channel.
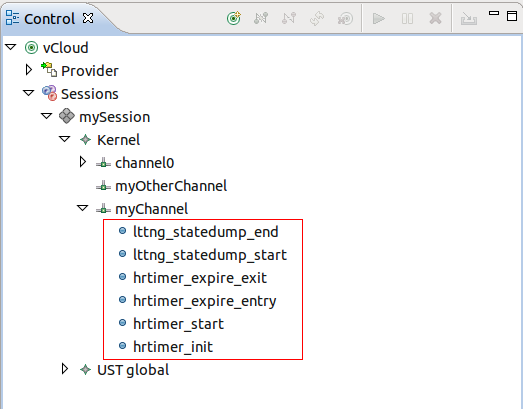
Select a session from the Session List drop-down menu, a channel from the Channel List drop-down menu and the press Ok. Upon successful operation, the selected events will be added to the selected session and channel of the domain that the selected provider belongs to. In case that there was no channel available, the domain and the default channel channel0 will be created for corresponding session. The newly added events will be ENABLED.
Adding Contexts to Channels and Events of a Domain
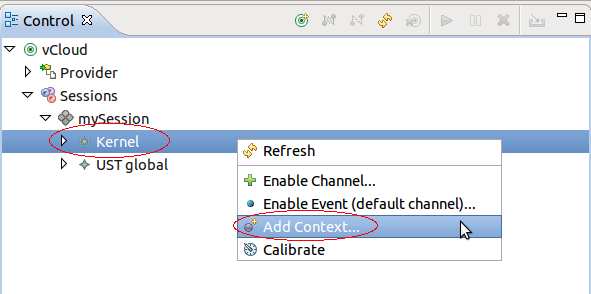
It is possible to add contexts to channels and events. Adding contexts on channels and events from the domain level, will enable the specified contexts to all channels of the domain and all their events. To add contexts on the domain level, select a domain, click right mouse button on a domain tree node (e.g. provider Kernel) and select the menu item Add Context... from the context-sensitive menu.
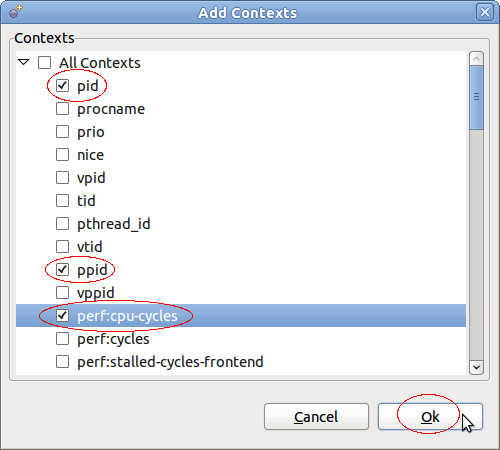
A new display will open for selecting one or more contexts to add.
The tree shows all available context that can be added. Select one or more context and the press Ok. Upon successful operation, the selected context will be added to all channels and their events of the selected domain.
Note: The LTTng UST tracer only supports contexts procname, pthread_id, vpid vtid. Adding any other contexts in the UST domina will fail.
Adding Contexts to All Events of a Channel
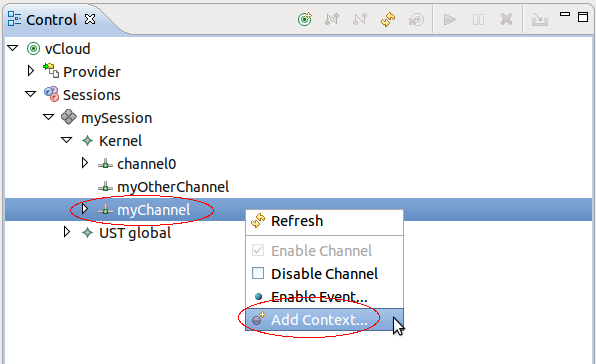
Adding contexts on channels and events from the channel level, will enable the specified contexts to all events of the selected channel. To add contexts on the channel level, select a channel, click right mouse button on a channel tree node and select the menu item Add Context... from the context-sensitive menu.
A new display will open for selecting one or more contexts to add. Select one or more contexts as described in chapter Adding Contexts to Channels and Events of a Domain. Upon successful operation, the selected context will be added to all channels and their events of the selected domain. Note that the LTTng 2.0 tracer control on the remote host doesn't provide a way to retrieve added contexts. Hence it's not possible to display the context information in the GUI.
Adding Contexts to a Event of a Specific Channel
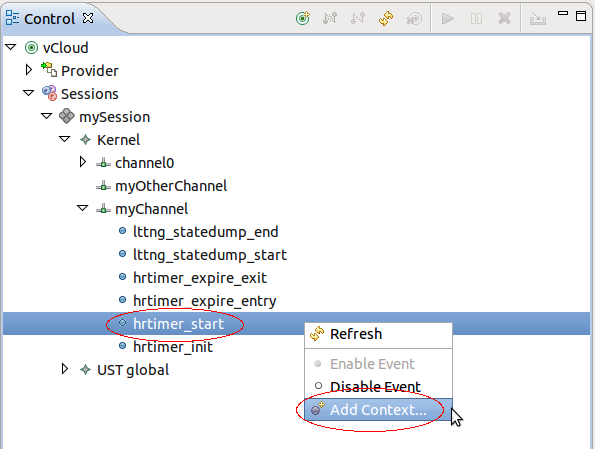
Adding contexts to a event of a channel, select an event of a channel, click right mouse button on the corresponding event tree node and select the menu item Add Context... from the context-sensitive menu.
A new display will open for selecting one or more contexts to add. Select one or more contexts as described in chapter Adding Contexts to Channels and Events of a Domain. Upon successful operation, the selected context will be added to the selected event.
Start Tracing
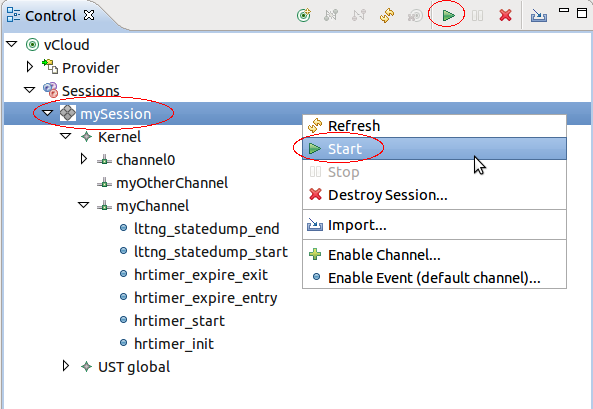
To start tracing, select one or more sessions to start in the Control View and press the Start button. Alternatively, press the right mouse button on the session tree nodes. A context-sensitive menu will show. Then select the Start menu item.
Upon successful operation, the tracing session will be ACTIVE and the icon of the session will be updated.
Stop Tracing
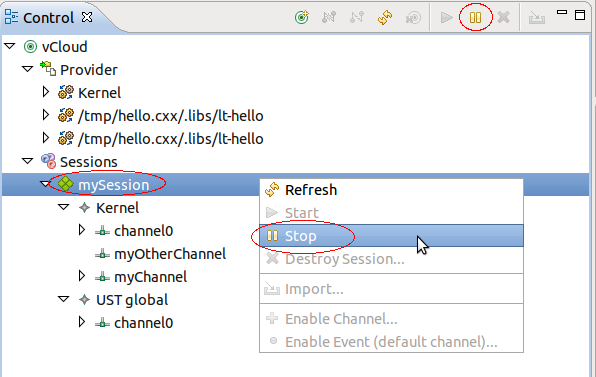
To stop tracing, select one or more sessions to stop in the Control View and press the Stop button. Alternatively, click the right mouse button on the session tree nodes. A context-sensitive menu will show. Then select the Stop menu item.
Upon successful operation, the tracing session will be INACTIVE and the icon of the session will be updated.
Destroying a Tracing Session
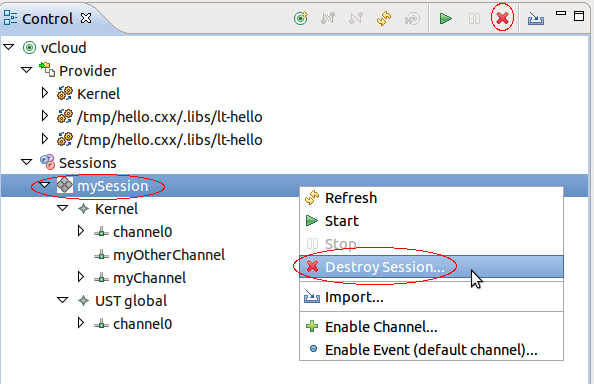
To destroy a tracing session, select one or more sessions to destroy in the Control View and press the Destroy button. Alternatively, click the right mouse button on the session tree node. A context-sensitive menu will show. Then select the Destroy... menu item. Note that the session has to be INACTIVE for this operation.
A confirmation dialog box will open. Click on Ok to destroy the session otherwise click on Cancel.
Upon successful operation, the tracing session will be destroyed and removed from the tree.
Refreshing the Node Information
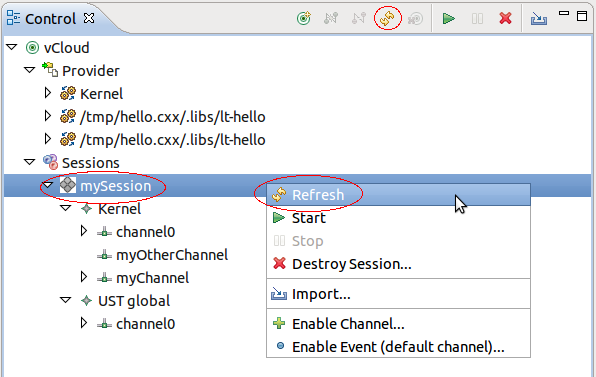
To refresh the remote host information, select any node in the tree of the Control View and press the Refresh button. Alternatively, click the right mouse button on any tree node. A context-sensitive menu will show. Then select the Refresh menu item.
Upon successful operation, the tree in the Control View will be refreshed with the remote host configuration.
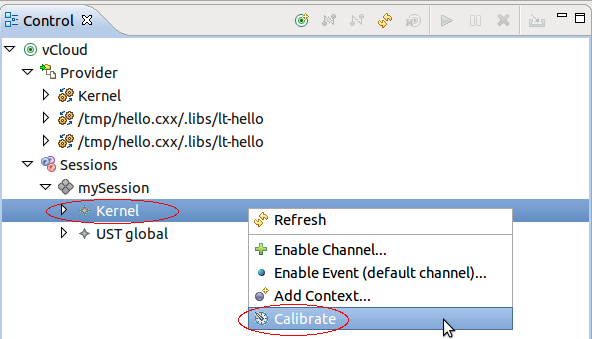
Quantifing LTTng overhead (Calibrate)
The LTTng calibrate command can be used to find out the combined average overhead of the LTTng tracer and the instrumentation mechanisms used. For now, the only calibration implemented is that of the kernel function instrumentation (kretprobes). To run the calibrate command, select the a domain (e.g. Kernel), click the right mouse button on the domain tree node. A context-sensitive menu will show. Select the Calibrate menu item.
Upon successful operation, the calibrate command is executed and relevant information is stored in the trace. Note: that the trace has to be active so that to command as any effect.
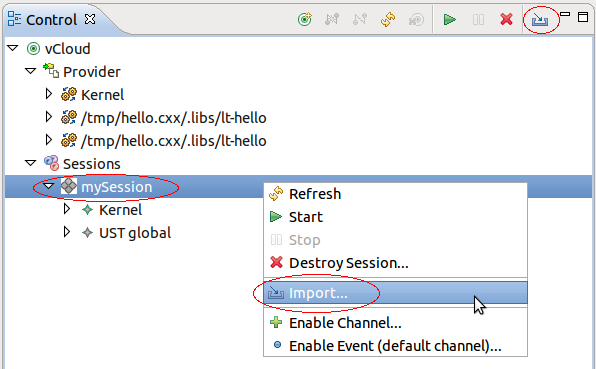
Importing Session Traces to a Tracing Project
To import traces from a tracing session, select the relevant session and click on the Import Button. Alternatively, click the right mouse button on the session tree node and select the menu item Import... from the context-sensitive menu.
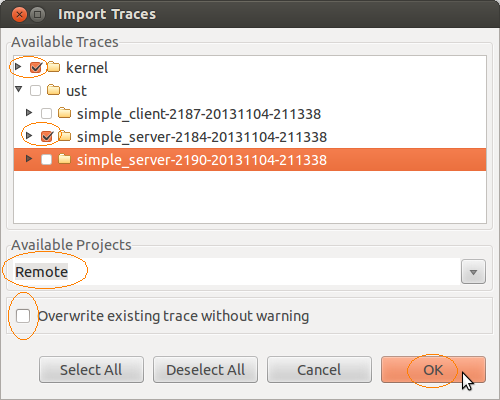
A new display will open for selecting the traces to import.
Select the trace to be imported by selecting the relevant traces in the tree viewer, select a tracing project from the Available Projects combo box and select the Overwrite button (Overwrite existing trace without warning) if required. Then press button Ok. Upon successful import operation the the selected traces will be stored in the Traces directory of the specified tracing project. From the Project Explorer view, the trace can be analyzed further.
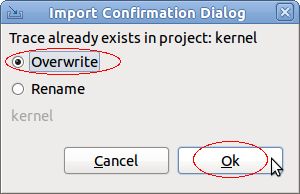
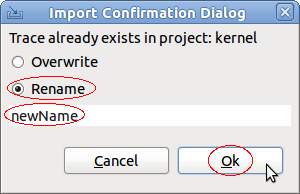
Note: If the overwrite button (Overwrite existing trace without warning) was not selected and a trace with the same name of a trace to be imported already exists in the project, then a new confirmation dialog box will open.
To Overwrite select the Overwrite Button and press Ok.
If the existing trace should not be overwritten select, then select the Rename option of the confirmation dialog box above, enter a new name and then press Ok.
Properties View
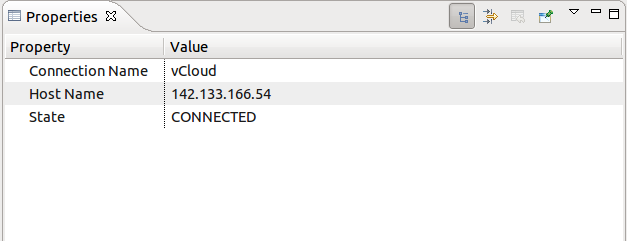
The Control View provides property information of selected tree component. Depending on the selected tree component different properties are displayed in the property view. For example, when selecting the node level the property view will be filled as followed:
List of properties:
- Host Properties
- Connection Name: The alias name to be displayed in the Control View.
- Host Name: The IP address or DNS name of the remote system.
- State: The state of the connection (CONNECTED, CONNECTING, DISCONNNECTING or DISCONNECTED).
- Kernel Provider Properties
- Provider Name: The name of the provider.
- UST Provider Properties
- Provider Name: The name of the provider.
- Process ID: The process ID of the provider.
- Event Properties (Provider)
- Event Name: The name of the event.
- Event Type: The event type (TRACEPOINT only).
- Log Level: The log level of the event.
- Session Properties
- Session Name: The name of the Session.
- Session Path: The path on the remote host where the traces will be stored.
- State: The state of the session (ACTIVE or INACTIVE)
- Domain Properties
- Domain Name: The name of the domain.
- Channel Properties
- Channel Name: The name of the channel.
- Number of Sub Buffers: The number of sub-buffers of the channel.
- Output type: The output type for the trace (e.g. splice() or mmap())
- Overwrite Mode: The channel overwrite mode (true for overwrite mode, false for discard)
- Read Timer Interval: The read timer interval.
- State: The channel state (ENABLED or DISABLED)
- Sub Buffer size: The size of the sub-buffers of the channel (in bytes).
- Switch Timer Interval: The switch timer interval.
- Event Properties (Channel)
- Event Name: The name of the event.
- Event Type: The event type (TRACEPOINT, SYSCALL or PROBE)..
- Log Level: The log level of the event.
- State: The Event state (ENABLED or DISABLED)
LTTng Tracer Control Preferences
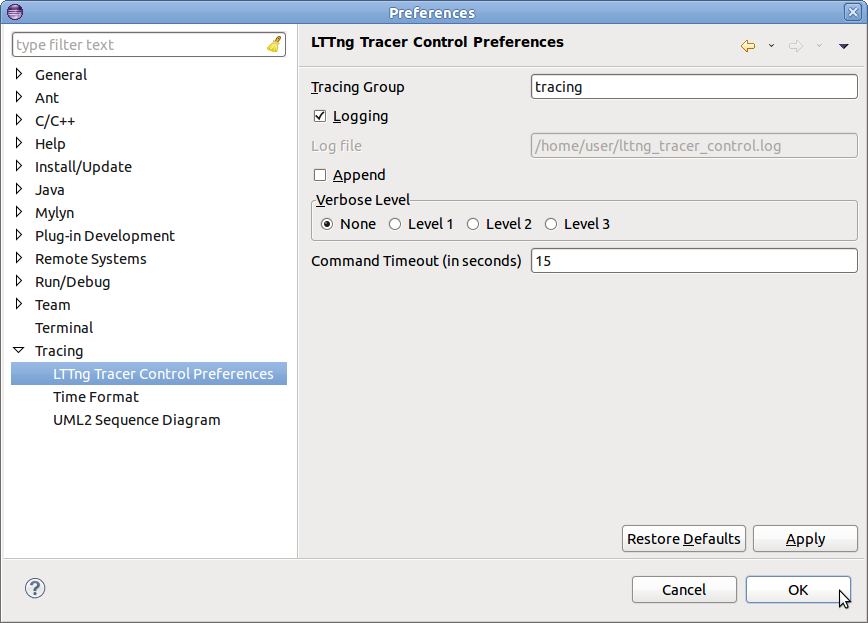
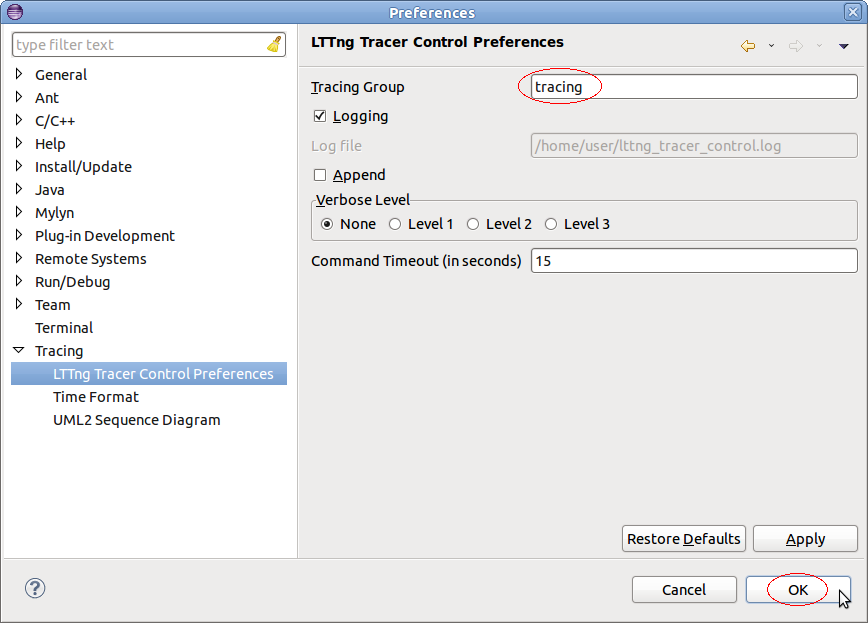
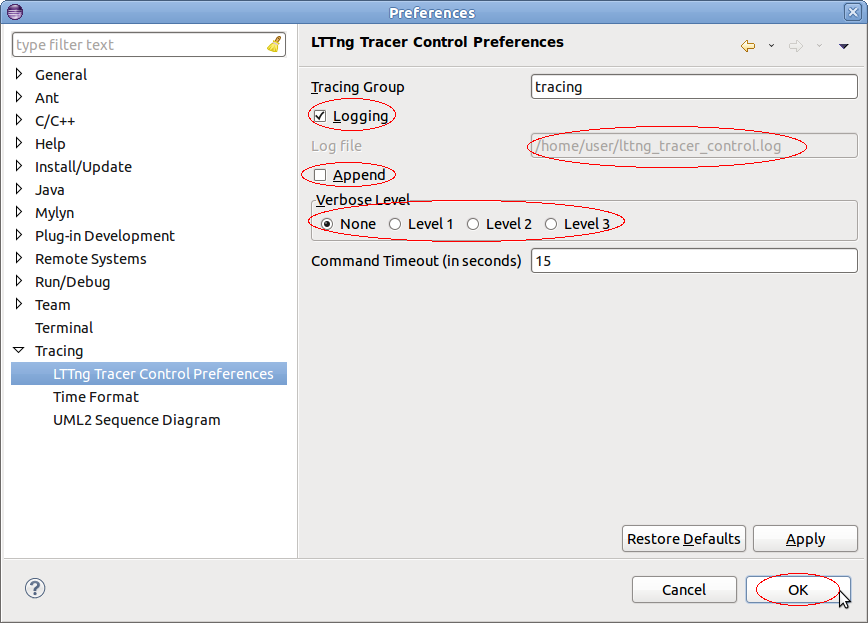
Serveral LTTng 2.0 tracer control preferences exists which can be configured. To configure these preferences, select Window->Preferences from the top level menu. The preference display will open. Then select Tracing->LTTng Tracer Control Preferences. This preferences page allows the user to specify the tracing group of the user and allows the user to configure the logging of LTTng 2.0 tracer control commands and results to a file.
To change the tracing group of the user which will be specified on each command line, enter the new group name in the Tracing Group text field and click ok. The default tracing group is tracing and can be restored by pressing the Restore Defaults button.
To configure logging of trace control commands and the corresponding command result to a file, selected the button Logging. To append to an existing log file, select the Append button. Deselect the Append button to overwrite any existing log file. It's possible to specify a verbose level. There are 3 levels with inceasing verbosity from Level 1 to Level 3. To change the verbosity level, select the relevant level or select None. If None is selected only commands and command results are logged. Then press on button Ok. The log file will be stored in the users home directory with the name lttng_tracer_control.log. The name and location cannot be changed. To reset to default preferences, click on the button Restore Defaults.
LTTng Kernel Analysis
Historically, LTTng was developped to trace the Linux kernel and, over time, a number of kernel-oriented analysis views were developped and organized in a perspective.
This section presents a description of the LTTng Kernel Perspective.
LTTng Kernel Perspective
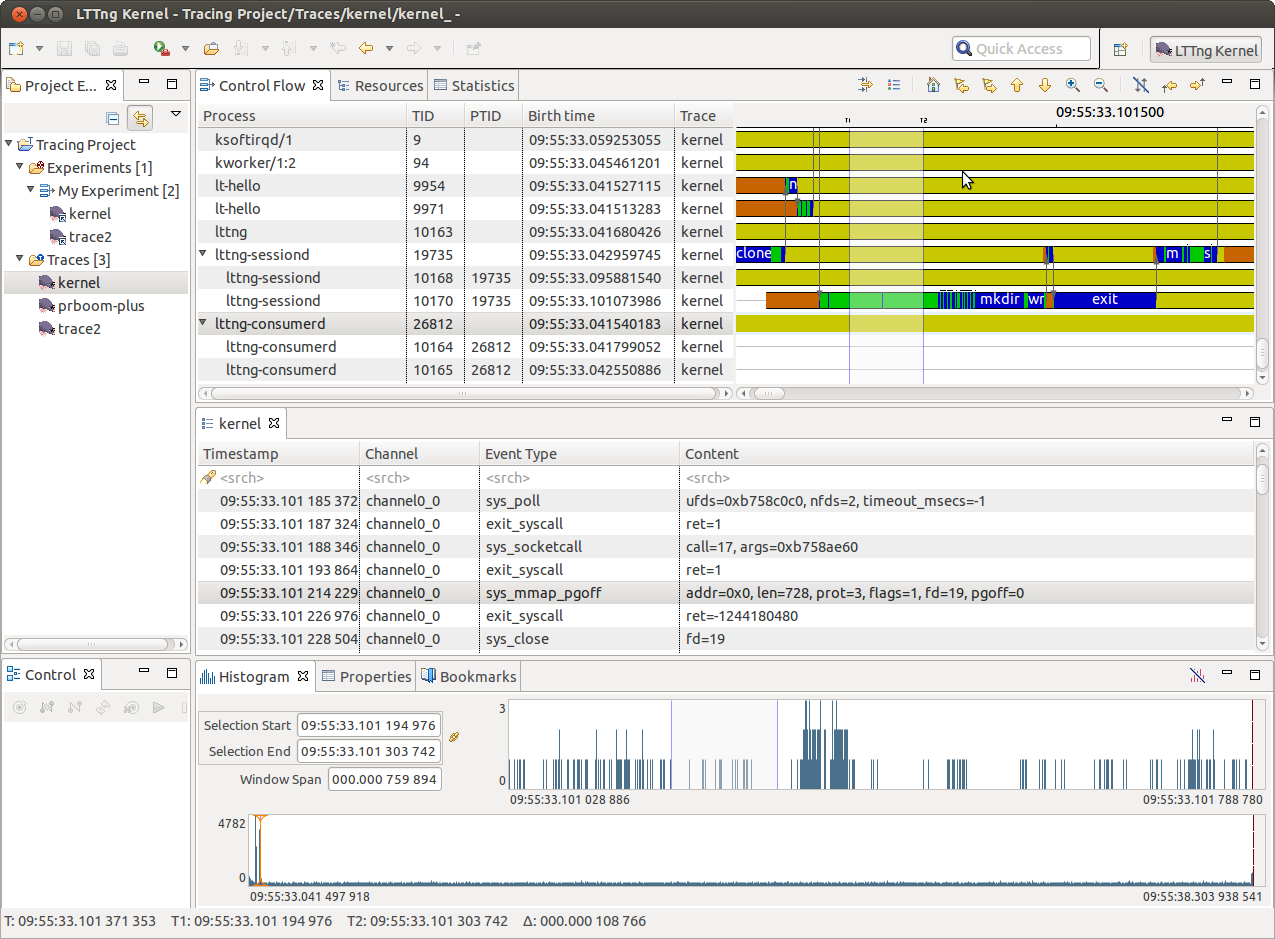
The LTTng Kernel perspective is built upon the Tracing Perspective, re-organizes them slightly and adds the following views:
- Control Flow View - to visualize processes state transitions
- Resources View - to visualize system resources state transitions
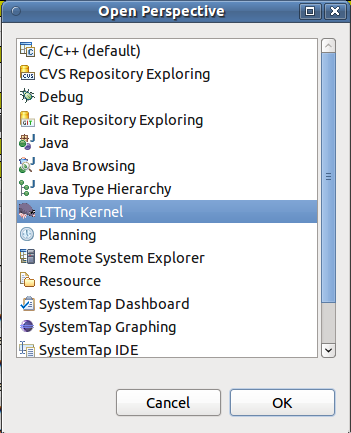
The perspective can be opened from the Eclipse Open Perspective dialog (Window > Open Perspective... > Other).
Control Flow View
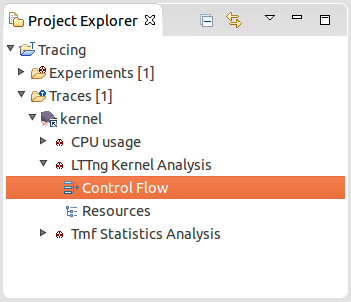
The Control Flow View is a LTTng-specific view that shows per-process events graphically. To enable it, select Control Flow under LTTng within the Show View window (Window -> Show View -> Other...):
You should get something like this:
The view is divided into the following important sections: process tree, process TID, PTID and birth time, states flow and the toolbar.
The following sections provide detailed information for each part of the Control Flow View.
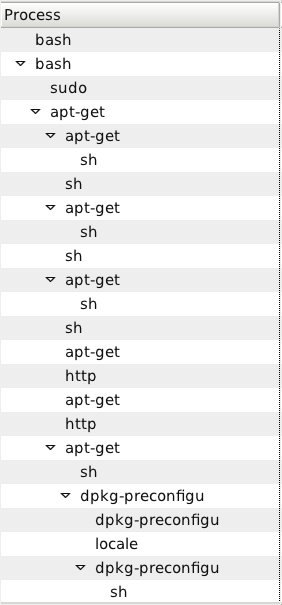
Process tree and informations
Processes are organized as a tree within this view. This way, child and parent processes are easy to identify.
The layout is based on the states computed from the trace events.
A given process may be shown at different places within the tree since the nodes are unique (TID, birth time) couples. This means that if process B of parent A dies, you'll still see it in the tree. If process A forks process B again, it will be shown as a different node since it won't have the same birth time (and probably not the same TID). This has the advantage that the tree, once loaded, never changes: horizontal scrolling within the states flow remains possible.
The TID column shows the process node's thread ID and the PTID column shows its parent thread ID (nothing is shown if the process has no parent).
States flow
This part of the Control Flow View is probably the most interesting one. Using the mouse, you can navigate through the trace (go left, right) and zoom on a specific region to inspect its details.
The colored bars you see represent states for the associated process node. When a process state changes in time, so does the color. States colors legend is available through a toolbar button:
This dark yellow is what you'll see most of the time since scheduling puts processes on hold while others run.
The vertical blue line is the current time indicator.
Using the mouse
The states flow is usable with the mouse. The following actions are set:
- drag horizontally: pan left or right
- click on a colored bar: the associated process node is selected and the current time indicator is moved where the click happened
- mouse wheel up/down: zoom in or out
- drag the time ruler horizontally: zoom in or out
- drag the time ruler horizontally with the right button: zoom region
- double-click the time ruler: reset zoom
When the current time indicator is changed (when clicking in the states flow), all the other views are synchronized. For example, the Events View will show the event matching the current time indicator. The reverse behaviour is also implemented: selecting an event within the Events View will update the Control Flow View current time indicator.
Incomplete regions
You'll notice small dots over the colored bars at some places:
Those dots mean the underlying region is incomplete: there's not enough pixels to view all the events. In other words, you have to zoom in.
When zooming in, small dots start to disappear:
When no dots are left, you are viewing all the events and states within that region.
Zoom region
To zoom in on a specific region, right-click and drag the time ruler in order to draw a time range:
The states flow horizontal space will only show the selected region.
Tooltips
Hover the cursor over a colored bar and a tooltip will pop up:
The tooltip indicates:
- the process name
- the pointed state name
- the pointed state date and start/stop times
- the pointed state duration (seconds)
Toolbar
The Control Flow View toolbar, located at the top right of the view, has shortcut buttons to perform common actions:
The Previous event and Next event buttons update the current time indicator so that it's on the previous or next event.
The Previous process and Next process buttons select the previous and next process node within the process tree.
Resources View
This view is specific to kernel trace. To open it, go in Window -> Show View -> Other... and select LTTng/Resources in the list.
This view shows the state of system resources i.e. if changes occured during the trace either on CPUs, IRQs or soft IRQs, it will appear in this view. The left side of the view present a list of resources that are affected by at least one event of the trace. The right side illustrate the state in which each resource is at some point in time.
Just like other views, according to which trace points and system calls are activated, the content of this view may change from one trace to another.
Each state are represented by one color so it is faster to say what is happening.
To go through the state of a resource, you first have to select the resource and the timestamp that interest you. For the latter, you can pick some time before the interesting part of the trace.
Then, by selecting Next Event, it will show the next state transition and the event that occured at this time.
This view is also synchronized with the others : histogram, events view, control flow view, etc.
See using the mouse and zoom region .
Incomplete regions
See Incomplete regions.
Toolbar
See Toolbar.
Events View
The LTTng Kernel Events View is the plain TMF Events Views except that it provide its own specialized viewer to replace the standard one. In short, it has exactly the same behaviour but the layout is slightly different:
- Timestamp: the event timestamp
- Channel: the event channel (data collector)
- Event Type: the event type (or kernel marker)
- Content: the raw event content
Limitations
TBD
How to use LTTng to diagnose problems
LTTng is a tracer, it will give an enormous amount of information about the system it is running on. This means it can solve many types of problems.
The following are examples of problems that can be solved with a tracer.
Random stutters
Bob is running a computer program and it stutters periodically every 2 minutes. The CPU load is relatively low and Bob isn't running low on RAM.
He decides to trace his complete system for 10 minutes. He opens the LTTng view in eclipse. From the control, he creates a session and enables all kernel tracepoints.
He now has a 10 GB trace file. He imports the trace to his viewer and loads it up.
A cursory look at the histogram bar on the bottom show relatively even event distribution, there are no interesting spikes, so he will have to dig deeper to find the issue. If he had seen a spike every 2 minutes, there would be strong chances this would be the first thing to investigate as it would imply a lot of kernel activity at the same period as his glitch, this would have been a path to investigate.
As Bob suspects that he may be having some hardware raising IRQs or some other hardware based issue and adding delays. He looks at the ressource view and doesn't see anything abnormal.
Bob did note an exact second one glitch occured: 11:58:03. He zooms into the time range or 11:58:02-11:58:04 using the histogram.He is happy to see the time is human readable local wall clock time and no longer in "nanseconds since the last reboot".
In the resource view, once again, he sees many soft irqs being raised at the same time, around the time his gui would freeze. He changes views and looks at the control flow view at that time and sees a process spending a lot of time in the kernel: FooMonitor- his temperature monitoring software.
At this point he closes FooMonitor and notices the bug dissapeared. He could call it a day but he wants to see what was causing the system to freeze. He cannot justify closing a piece of software without understanding the issue. It may be a conflict that HIS software is causing after all.
The system freezes around the time this program is running. He clicks on the process in the control flow view and looks at the corresponding events in the detailed events view. He sees: open - read - close repeated hundreds of times on the same file. The file being read was /dev/HWmonitor. He sends a report to the FooMonitor team and warns his team that FooMonitor was glitching their performance.
The FooMonitor team finds that they were calling a system bus call that would halt a cpu while reading the temperature so that the core would not induce an 0.1 degree error in the reading, by disabling this feature, they improve their software and stop the glitches from occurring on their custommer's machine. They also optimize their code to open the file read and clone it once.
By using system wide kernel tracing, even without deep kernel knowledge Bob was able to isolate a bug in a rogue piece of software in his system.
Slow I/O
Alice is running her server. She noticed that one of her nodes was slowing down, and wasn't sure why, upon reading the trace she noticed that her time between a block request and complete was around 10ms.
This is abnormal, normally her server handles IOs in under 100us, since they are quite local.
She walks up to the server and hears the hard drive thrashing, This prompts her to look up in the events view the sectors being read in the block complete requests. There are her requests interleaved with other ones at the opposite side of the hard drive.
She sees the tracer writing but there is another process that is writing to the server disk non stop. She looks in the control flow view and sees that there's a program from another fellow engineer, "Wally" that is writing in his home in a loop "All work and no play makes Jack a dull boy.".
Alice kills the program, and immediately the server speeds up. She then goes to discuss this with Wally and implements strict hard disk quotas on the server.

