Notice: this Wiki will be going read only early in 2024 and edits will no longer be possible. Please see: https://gitlab.eclipse.org/eclipsefdn/helpdesk/-/wikis/Wiki-shutdown-plan for the plan.
Difference between revisions of "Linux Tools Project/Callgraph/User Guide"
(→Features) |
|||
| Line 1: | Line 1: | ||
| − | = | + | = Overview = |
| − | + | The Eclipse-Callgraph plug-in provides a visual function trace of a program. This allows you to view a visualization of selected (or even all) functions used by the profiled application. | |
| − | |||
| − | |||
| − | + | This plug-in allows you to profile C/C++ projects directly within the Eclipse IDE, providing various runtime details such as: | |
| − | + | *The relationship between function calls | |
| − | + | *Number of times each function was called | |
| − | + | *Time taken by each instance of a function (relative to the program's execution time) | |
| + | *Time taken by all instances of a function (relative to program's execution time) | ||
| − | |||
| − | |||
| − | + | Eclipse-Callgraph uses SystemTap to perform function traces. For more information about SystemTap, refer to the [http://sources.redhat.com/systemtap/SystemTap_Beginners_Guide/ SystemTap Beginner's Guide]. | |
| + | = Installation = | ||
| − | + | Performing visual function traces with Eclipse-Callgraph requires three components: | |
| − | * | + | *the Eclipse-Callgraph package |
| − | * | + | *SystemTap |
| − | * | + | *the kernel information packages required by SystemTap |
| − | + | ||
| − | |||
| − | + | You can install all of these items through '''yum'''. To install Eclipse-Callgraph and SystemTap, run: | |
| + | <pre>yum install eclipse-callgraph systemtap systemtap-runtime -y</pre> | ||
| + | |||
| + | |||
| + | The required kernel information packages are the matching '''-devel''', '''-debuginfo''', and '''-debuginfo-common''' packages of the kernel you wish to profile. You can use '''yum''' or '''debuginfo-install''' to install these packages. For more details about installing SystemTap, refer to [http://sources.redhat.com/systemtap/SystemTap_Beginners_Guide/using-systemtap.html#using-setup Installation and Setup] from the [http://sources.redhat.com/systemtap/SystemTap_Beginners_Guide/ SystemTap Beginner's Guide]. | ||
| + | |||
| + | = General Usage = | ||
| + | |||
| + | All the profiling plugins (including Eclipse-Callgraph) are accessible from the C/C++ perspective. Right-click on an application's C/C++ source file (in the Editor view) or binary (in the Package Explorer view). | ||
| + | |||
| + | <center> | ||
| + | [[File:Profile-screen.png]] | ||
| + | </center> | ||
| + | |||
| + | = Features = | ||
| + | |||
| + | == Call Graph == | ||
| + | Renders a visual function trace of the program, tracking selected or all functions. | ||
| − | + | <br> This feature comes with a few different display options and various other information such as : | |
| − | + | ||
| − | + | ||
| − | + | ||
| + | *function parent/children relationships | ||
| + | *number of times a function is called | ||
| + | *time spent in an instance of a function | ||
| + | *time spent in all instances of a function | ||
| − | + | <br> | |
| + | <center>[[Image:Stapgraph menu.png]]</center> | ||
| + | The following types of views are available to see the call hierarchy of the functions belonging to the executable. | ||
| − | + | <br> [[Image:Radial view.png]] [[Image:Tree view.png]] [[Image:Box view.png]] [[Image:Aggregate view.png]] | |
| + | <br> | ||
| − | == | + | == Linkage To Source Code == |
| − | + | The graph views are linked to their source code -- hold CTRL and double-click any function in a non-aggregate view to be taken to where that function was called. Doing the same for an aggregate node will take you to where that function is defined. | |
| − | < | + | <br> |
| + | == Function Calls In Chronological Order == | ||
| − | + | Using the "Go To" menu, one can step through functions in chronological order, using the Previous/Next options. | |
| + | <center>[[Image:Callgraph goto menu.png]]</center> | ||
| + | <br> | ||
| − | + | == Open / Save Call Graphs == | |
| − | <center>[[Image: | + | Certain large projects might take longer to render, and so users have the ability to save the data collected from having profiled their project. Loading the data file and attempting to render that will take a much shorter time than attempting to go through the full process of profiling a project. |
| + | <center>[[Image:Callgraph file menu.png]]</center> | ||
Revision as of 21:15, 18 August 2010
Contents
Overview
The Eclipse-Callgraph plug-in provides a visual function trace of a program. This allows you to view a visualization of selected (or even all) functions used by the profiled application.
This plug-in allows you to profile C/C++ projects directly within the Eclipse IDE, providing various runtime details such as:
- The relationship between function calls
- Number of times each function was called
- Time taken by each instance of a function (relative to the program's execution time)
- Time taken by all instances of a function (relative to program's execution time)
Eclipse-Callgraph uses SystemTap to perform function traces. For more information about SystemTap, refer to the SystemTap Beginner's Guide.
Installation
Performing visual function traces with Eclipse-Callgraph requires three components:
- the Eclipse-Callgraph package
- SystemTap
- the kernel information packages required by SystemTap
You can install all of these items through yum. To install Eclipse-Callgraph and SystemTap, run:
yum install eclipse-callgraph systemtap systemtap-runtime -y
The required kernel information packages are the matching -devel, -debuginfo, and -debuginfo-common packages of the kernel you wish to profile. You can use yum or debuginfo-install to install these packages. For more details about installing SystemTap, refer to Installation and Setup from the SystemTap Beginner's Guide.
General Usage
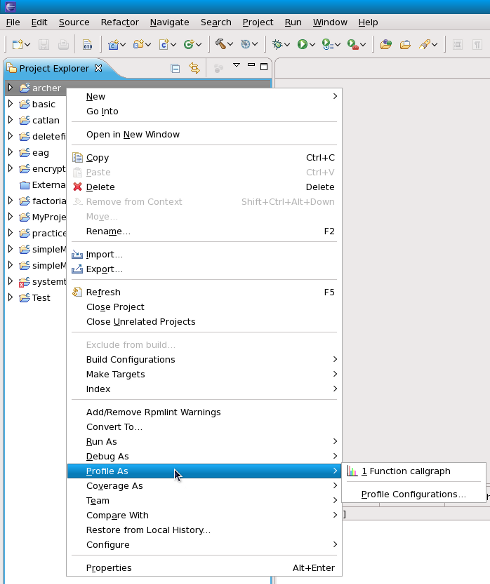
All the profiling plugins (including Eclipse-Callgraph) are accessible from the C/C++ perspective. Right-click on an application's C/C++ source file (in the Editor view) or binary (in the Package Explorer view).
Features
Call Graph
Renders a visual function trace of the program, tracking selected or all functions.
This feature comes with a few different display options and various other information such as :
- function parent/children relationships
- number of times a function is called
- time spent in an instance of a function
- time spent in all instances of a function
The following types of views are available to see the call hierarchy of the functions belonging to the executable.
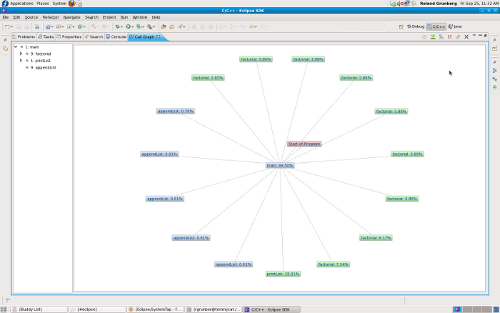
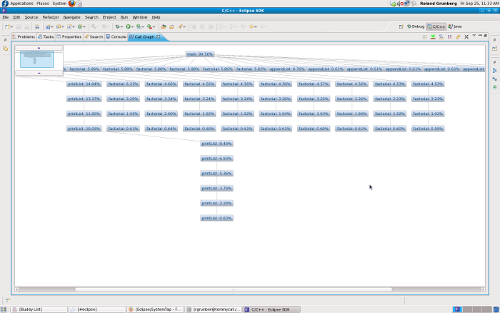 File:Box view.png File:Aggregate view.png
Linkage To Source Code
The graph views are linked to their source code -- hold CTRL and double-click any function in a non-aggregate view to be taken to where that function was called. Doing the same for an aggregate node will take you to where that function is defined.
Function Calls In Chronological Order
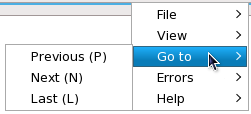
Using the "Go To" menu, one can step through functions in chronological order, using the Previous/Next options.
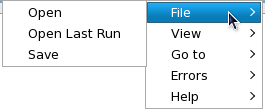
Open / Save Call Graphs
Certain large projects might take longer to render, and so users have the ability to save the data collected from having profiled their project. Loading the data file and attempting to render that will take a much shorter time than attempting to go through the full process of profiling a project.
