Notice: this Wiki will be going read only early in 2024 and edits will no longer be possible. Please see: https://gitlab.eclipse.org/eclipsefdn/helpdesk/-/wikis/Wiki-shutdown-plan for the plan.
Difference between revisions of "Linux Tools Project/Callgraph/User Guide"
(New page: == Installation == Installation of the Eclipse SystemTap plugin will be done through the yum repository. Users can simply type from command-line : 'yum install eclipse-callgraph' == Ge...) |
(→General Usage) |
||
| (20 intermediate revisions by 8 users not shown) | |||
| Line 1: | Line 1: | ||
| − | = | + | = Overview = |
| − | + | The Eclipse Callgraph plug-in provides a visual function trace of a program. This allows you to view a visualization of selected (or even all) functions used by the profiled application. | |
| − | |||
| − | + | This plug-in allows you to profile C/C++ projects directly within the Eclipse IDE, providing various runtime details such as: | |
| − | + | *The relationship between function calls | |
| + | *Number of times each function was called | ||
| + | *Time taken by each instance of a function (relative to the program's execution time) | ||
| + | *Time taken by all instances of a function (relative to program's execution time) | ||
| + | |||
| + | Eclipse Callgraph uses SystemTap to perform function traces. For more information about SystemTap, refer to the [http://sources.redhat.com/systemtap/SystemTap_Beginners_Guide/ SystemTap Beginner's Guide]. | ||
| + | |||
| + | = Installation = | ||
| + | |||
| + | Performing visual function traces with Eclipse Callgraph requires three components: | ||
| + | |||
| + | *the Eclipse Callgraph plugins | ||
| + | *SystemTap | ||
| + | *the kernel information packages required by SystemTap | ||
| + | |||
| + | |||
| + | On Fedora, you can install all of these items through '''yum'''. To install SystemTap, run: | ||
| + | <pre>yum -y install systemtap systemtap-runtime</pre> | ||
| + | |||
| + | |||
| + | The required kernel information packages are the matching '''-devel''', '''-debuginfo''', and '''-debuginfo-common''' packages of the kernel you wish to profile. You can use '''yum''' or '''debuginfo-install''' to install these packages. It is advised that you add your user-id to both the '''stapdev''' and '''stapusr''' groups. If you see error messages regarding '''avahi''' or if you get a message saying: "Unable to find server", this is due to your user-id not being part of the '''stapdev''' group. When adding your user-id to these special groups, you will need to logout and login again for the changes to take effect. | ||
| + | |||
| + | For more details about installing SystemTap, refer to [http://sources.redhat.com/systemtap/SystemTap_Beginners_Guide/using-systemtap.html#using-setup Installation and Setup] from the [http://sources.redhat.com/systemtap/SystemTap_Beginners_Guide/ SystemTap Beginner's Guide]. | ||
| + | |||
| + | = General Usage = | ||
| + | |||
| + | All the profiling plugins (including Eclipse Callgraph) are accessible from the C/C++ perspective. There are two ways to start using Eclipse Callgraph via the '''Profiling Tools''' project menu: | ||
| + | |||
| + | Using '''Profiling Tools > Function callgraph''' | ||
<center> | <center> | ||
| − | [[Image: | + | [[Image:Callgraph_orig_submenu.png]] |
</center> | </center> | ||
| − | + | or using '''Profiling Tools > Profile Timing''' and setting the timing tool to be Callgraph. | |
| + | <center> | ||
| + | [[Image:Callgraph_timing_submenu.png]] | ||
| + | </center> | ||
| − | ''' | + | To properly set the preferences you can go to '''C/C++->Profiling->Categories->Timing''' and set the default timing tool to be Callgraph. |
| + | <center> | ||
| + | [[Image:Callgraph_global_preferences.png]] | ||
| + | </center> | ||
| − | + | Alternatively, you can set project specific preferences which override workspace preferences by using project '''Properties->C/C++ General->Profiling Categories->Timing'''. | |
| + | <center> | ||
| + | [[Image:Callgraph_proj_preferences.png]] | ||
| + | </center> | ||
| + | You can also profile your application using Profile as...->Local C/C++ Application whereby you have set the profiling tool in the Profiler tab to be Callgraph. | ||
| + | <center> | ||
| + | [[Image:Callgraph_tab.png]] | ||
| + | </center> | ||
| − | This | + | This will open a dialog from which you can select an executable to profile. |
| + | <center> | ||
| + | [[Image:Eclipsecallgraph-profilewhich.png]] | ||
| + | </center> | ||
| − | |||
| − | |||
| − | |||
| − | |||
| + | After selecting an executable to profile, Eclipse Callgraph will ask which files to probe. By default, all source files in the project will be selected. | ||
| + | <center> | ||
| + | [[Image:Selectfilestoprobe.png]] | ||
| + | </center> | ||
| − | + | = Callgraph Perspectives = | |
| − | The | + | The '''Callgraph''' view's toolbar allows you to select a perspective and perform other functions. |
| + | == Radial View == | ||
| − | + | The '''Radial View''' displays all functions branching out from '''main()''', with each function represented as a node. A purple node means that the program terminates at the function. A green node signifies that the function call has nested functions, whereas gray nodes signify otherwise. Double-clicking on a node will show its parent (colored pink) and children. The lines connecting different nodes also display how many times '''main()''' called each function. | |
| − | + | <center> | |
| − | [[Image: | + | [[Image:Eclipsecallgraph-radialview.png]] |
| − | + | </center> | |
| + | The left window of the '''Radial View''' lists all of the functions shown in the view. This window also allows you to view nested functions, if any. A green bullet point means the program either starts or terminates at that function. | ||
| − | ''' | + | == Tree View == |
| + | |||
| + | The '''Tree View''' is similar to the '''Radial View''', except that it only displays all descendants of a selected node ('''Radial View''' only displays functions one call depth away from a selected node). The top left of '''Tree View''' also includes a thumbnail viewer to help you navigate through different call depths of the function tree. | ||
| + | <center> | ||
| + | [[Image:Eclipsecallgraph-treeview.png]] | ||
| + | </center> | ||
| + | |||
| + | == Level View == | ||
| + | |||
| + | '''Level View''' displays all function calls and any nested function calls branching out from a selected node. However, '''Level View''' groups all functions of the same call depth together, giving a clearer visualization of a program's function call execution sequences. | ||
| + | <center> | ||
| + | [[Image:Eclipsecallgraph-levelview.png]] | ||
| + | </center> | ||
| + | |||
| + | '''Level View''' also lets you navigate through different call depths using the thumbnail viewer's '''More nodes above''' and '''More nodes below''' buttons. | ||
| + | <center> | ||
| + | [[Image:Eclipsecallgraph-thumb.png]] | ||
| + | </center> | ||
| + | |||
| + | == Aggregate View == | ||
| + | |||
| + | The '''Aggregate View''' depicts all functions as boxes; the size of each box represents a function's execution time relative to the total running time of the program. Darker-colored boxes represent functions that are called more times relative to others; for example, in the following figure, the '''CallThisThirtyTimes''' function is called the most number of times (150). | ||
| + | <center> | ||
| + | [[Image:Eclipsecallgraph-agg.png]] | ||
| + | </center> | ||
| + | |||
| + | = General Usage = | ||
| + | |||
| + | Most of Eclipse Callgraph's general functions are available through the '''Callgraph''' view's toolbar and '''View Menu'''. | ||
| + | |||
| + | == Collapse Mode == | ||
| + | |||
| + | The '''Callgraph''' view's toolbar also features a '''Collapse Mode''' button. This button groups all identical functions (i.e. those with identical names and call histories) together into one node. Doing so can be helpful in reducing screen clutter for programs where many functions get called multiple times. | ||
| + | <center> | ||
| + | [[Image:Eclipsecallgraph-collapse.png]] | ||
| + | </center> | ||
| − | + | == Watching function calls in chronological order == | |
| + | To play a visual representation of a function trace, click the '''View Menu''' button then navigate to '''Goto'''. This menu will allow you to pause, step through, or mark each function as it executes. | ||
| + | <center>[[Image:Callgraph goto menu.png]]</center> | ||
| − | + | == Code link == | |
| − | + | The graph views are linked to the source code as well. To navigate to where a function is called in the code, hold '''Ctrl''' while double-clicking on a function's node (in any view except '''Aggregate View'''). Doing so will open the corresponding source file in the Eclipse editor and highlight the function call. | |
| − | + | To navigate to a function's definition in the source, hold '''Ctrl''' while double-clicking on a function's node in the '''Aggregate View'''. Doing so will open the corresponding source file in the Eclipse editor and highlight the function definition. | |
| − | + | == Save/load profile runs == | |
| − | + | Large projects may take longer to render; as such, Eclipse Callgraph allows you to save the data collected from a profile run. Loading the data file and attempting to render it will take a much shorter time than attempting to go through the full process of profiling a project. | |
| − | <center>[[Image: | + | To save or load data from a profile run, navigate to '''File''' (under the '''View Menu'''); this will display different options relating to saving and loading profile runs. |
| + | <center>[[Image:Callgraph file menu.png]]</center> | ||
Latest revision as of 14:56, 28 May 2013
Contents
Overview
The Eclipse Callgraph plug-in provides a visual function trace of a program. This allows you to view a visualization of selected (or even all) functions used by the profiled application.
This plug-in allows you to profile C/C++ projects directly within the Eclipse IDE, providing various runtime details such as:
- The relationship between function calls
- Number of times each function was called
- Time taken by each instance of a function (relative to the program's execution time)
- Time taken by all instances of a function (relative to program's execution time)
Eclipse Callgraph uses SystemTap to perform function traces. For more information about SystemTap, refer to the SystemTap Beginner's Guide.
Installation
Performing visual function traces with Eclipse Callgraph requires three components:
- the Eclipse Callgraph plugins
- SystemTap
- the kernel information packages required by SystemTap
On Fedora, you can install all of these items through yum. To install SystemTap, run:
yum -y install systemtap systemtap-runtime
The required kernel information packages are the matching -devel, -debuginfo, and -debuginfo-common packages of the kernel you wish to profile. You can use yum or debuginfo-install to install these packages. It is advised that you add your user-id to both the stapdev and stapusr groups. If you see error messages regarding avahi or if you get a message saying: "Unable to find server", this is due to your user-id not being part of the stapdev group. When adding your user-id to these special groups, you will need to logout and login again for the changes to take effect.
For more details about installing SystemTap, refer to Installation and Setup from the SystemTap Beginner's Guide.
General Usage
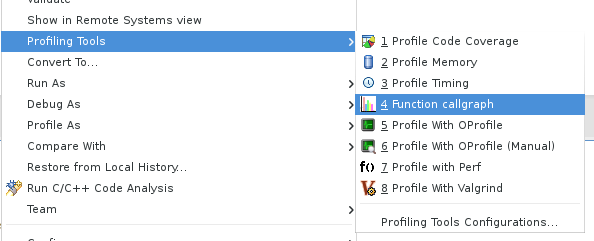
All the profiling plugins (including Eclipse Callgraph) are accessible from the C/C++ perspective. There are two ways to start using Eclipse Callgraph via the Profiling Tools project menu:
Using Profiling Tools > Function callgraph
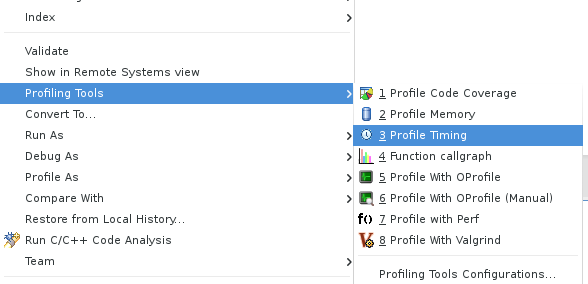
or using Profiling Tools > Profile Timing and setting the timing tool to be Callgraph.
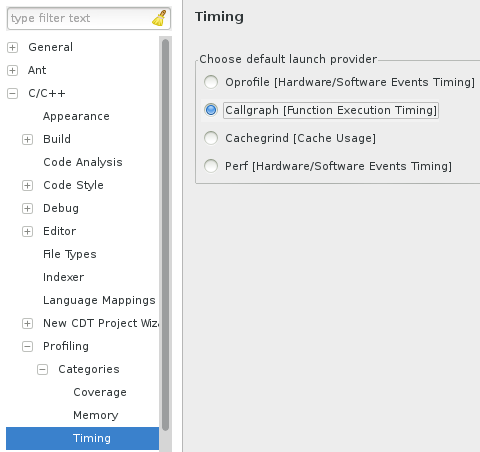
To properly set the preferences you can go to C/C++->Profiling->Categories->Timing and set the default timing tool to be Callgraph.
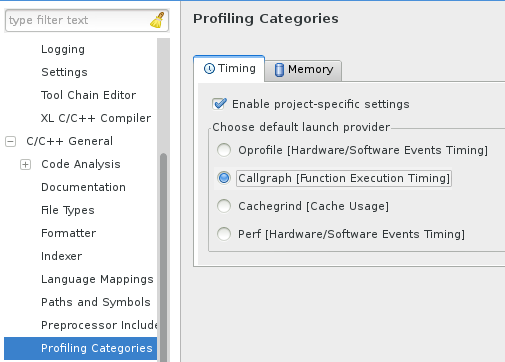
Alternatively, you can set project specific preferences which override workspace preferences by using project Properties->C/C++ General->Profiling Categories->Timing.
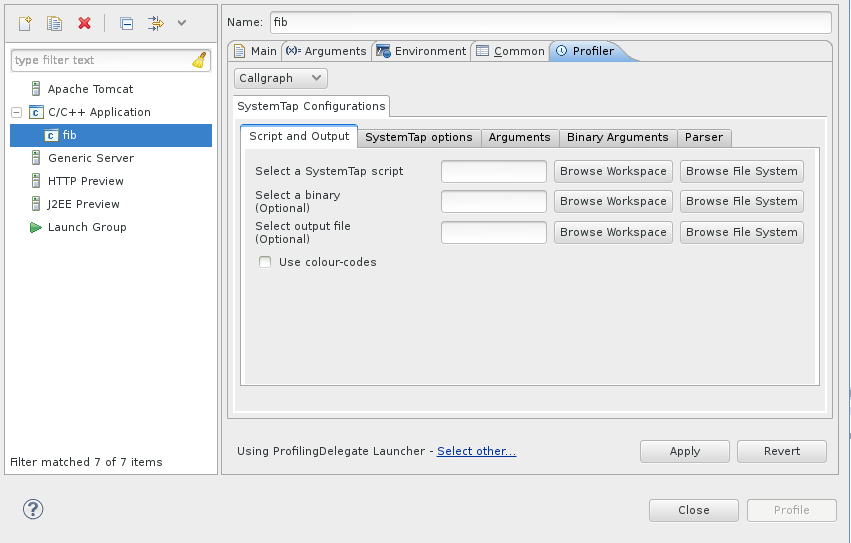
You can also profile your application using Profile as...->Local C/C++ Application whereby you have set the profiling tool in the Profiler tab to be Callgraph.
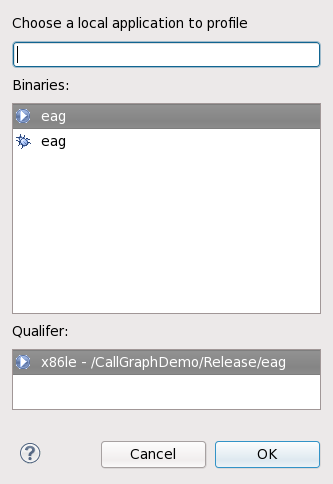
This will open a dialog from which you can select an executable to profile.
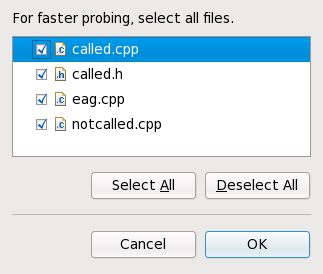
After selecting an executable to profile, Eclipse Callgraph will ask which files to probe. By default, all source files in the project will be selected.
Callgraph Perspectives
The Callgraph view's toolbar allows you to select a perspective and perform other functions.
Radial View
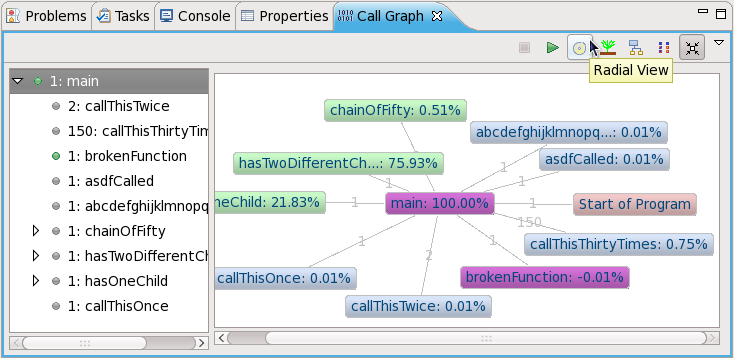
The Radial View displays all functions branching out from main(), with each function represented as a node. A purple node means that the program terminates at the function. A green node signifies that the function call has nested functions, whereas gray nodes signify otherwise. Double-clicking on a node will show its parent (colored pink) and children. The lines connecting different nodes also display how many times main() called each function.
The left window of the Radial View lists all of the functions shown in the view. This window also allows you to view nested functions, if any. A green bullet point means the program either starts or terminates at that function.
Tree View
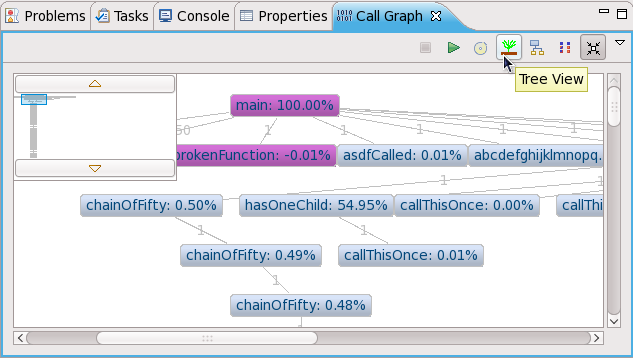
The Tree View is similar to the Radial View, except that it only displays all descendants of a selected node (Radial View only displays functions one call depth away from a selected node). The top left of Tree View also includes a thumbnail viewer to help you navigate through different call depths of the function tree.
Level View
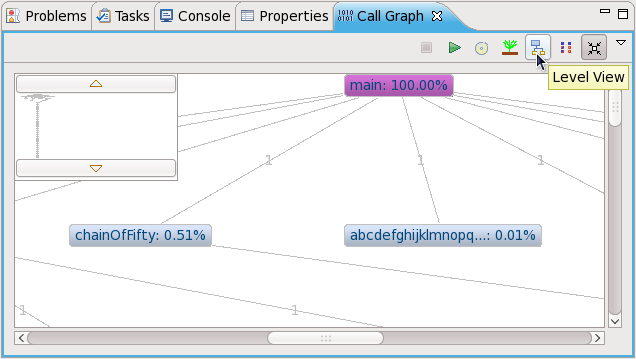
Level View displays all function calls and any nested function calls branching out from a selected node. However, Level View groups all functions of the same call depth together, giving a clearer visualization of a program's function call execution sequences.
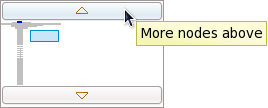
Level View also lets you navigate through different call depths using the thumbnail viewer's More nodes above and More nodes below buttons.
Aggregate View
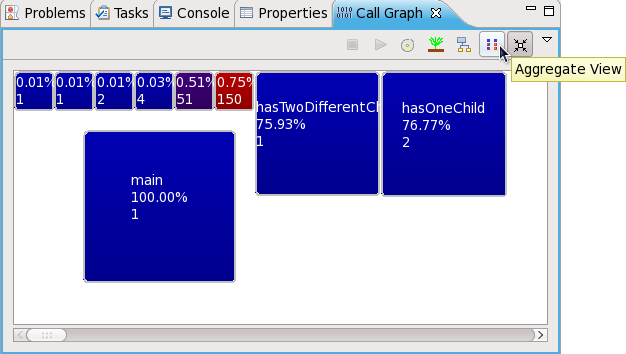
The Aggregate View depicts all functions as boxes; the size of each box represents a function's execution time relative to the total running time of the program. Darker-colored boxes represent functions that are called more times relative to others; for example, in the following figure, the CallThisThirtyTimes function is called the most number of times (150).
General Usage
Most of Eclipse Callgraph's general functions are available through the Callgraph view's toolbar and View Menu.
Collapse Mode
The Callgraph view's toolbar also features a Collapse Mode button. This button groups all identical functions (i.e. those with identical names and call histories) together into one node. Doing so can be helpful in reducing screen clutter for programs where many functions get called multiple times.
Watching function calls in chronological order
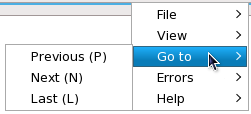
To play a visual representation of a function trace, click the View Menu button then navigate to Goto. This menu will allow you to pause, step through, or mark each function as it executes.
Code link
The graph views are linked to the source code as well. To navigate to where a function is called in the code, hold Ctrl while double-clicking on a function's node (in any view except Aggregate View). Doing so will open the corresponding source file in the Eclipse editor and highlight the function call.
To navigate to a function's definition in the source, hold Ctrl while double-clicking on a function's node in the Aggregate View. Doing so will open the corresponding source file in the Eclipse editor and highlight the function definition.
Save/load profile runs
Large projects may take longer to render; as such, Eclipse Callgraph allows you to save the data collected from a profile run. Loading the data file and attempting to render it will take a much shorter time than attempting to go through the full process of profiling a project.
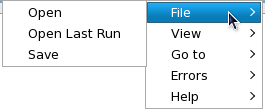
To save or load data from a profile run, navigate to File (under the View Menu); this will display different options relating to saving and loading profile runs.
