Notice: this Wiki will be going read only early in 2024 and edits will no longer be possible. Please see: https://gitlab.eclipse.org/eclipsefdn/helpdesk/-/wikis/Wiki-shutdown-plan for the plan.
Difference between revisions of "JSDT/Debug/Rhino"
(→Overview) |
|||
| Line 1: | Line 1: | ||
{{JSDT-Debug}} | {{JSDT-Debug}} | ||
| − | + | = Overview = | |
Support for the Rhino JavaScript interpreter is available in the JSDT feature and is provided to allow local and remote debugging of JavaScript using Rhino. | Support for the Rhino JavaScript interpreter is available in the JSDT feature and is provided to allow local and remote debugging of JavaScript using Rhino. | ||
| Line 10: | Line 10: | ||
*<code>org.eclipse.wst.jsdt.debug.rhino.debugger</code> - the Rhino debugger that can be embedded in a server for remote debugging | *<code>org.eclipse.wst.jsdt.debug.rhino.debugger</code> - the Rhino debugger that can be embedded in a server for remote debugging | ||
| − | + | = Local Rhino Debugging = | |
New to 1.3 is the ability to locally launch and debug JavaScript file(s) using Rhino. This new launching support includes context-sensitive launching from the platform and automatic source / script path updating. | New to 1.3 is the ability to locally launch and debug JavaScript file(s) using Rhino. This new launching support includes context-sensitive launching from the platform and automatic source / script path updating. | ||
The related New and Noteworthy entry is [http://www.eclipse.org/webtools/development/news/3.3M2/sourceediting.php here]. | The related New and Noteworthy entry is [http://www.eclipse.org/webtools/development/news/3.3M2/sourceediting.php here]. | ||
| − | + | == Launch Options == | |
The options on the '''Main''' tab allow you to specify the script you want to debug and the parameters use to configure the Rhino interpreter. The default options | The options on the '''Main''' tab allow you to specify the script you want to debug and the parameters use to configure the Rhino interpreter. The default options | ||
specified for a new configuration will provide you with the most general debugging experience, but you can tailor how the interpreter runs to reproduce specific scenarios. | specified for a new configuration will provide you with the most general debugging experience, but you can tailor how the interpreter runs to reproduce specific scenarios. | ||
| − | |||
| − | |||
| − | |||
| − | |||
There are a few options for Rhino which are as follows: | There are a few options for Rhino which are as follows: | ||
| Line 32: | Line 28: | ||
;<code>Log interpreter exceptions</code> : In certain cases, usually a fatal problem from the interpreter, exceptions will be thrown from Rhino. This option allows them to be forwarded to the Eclipse error log. | ;<code>Log interpreter exceptions</code> : In certain cases, usually a fatal problem from the interpreter, exceptions will be thrown from Rhino. This option allows them to be forwarded to the Eclipse error log. | ||
| − | === Include Paths | + | <gallery widths="340px" heights="260px" perrow="1"> |
| + | Image:Local_rhino_main.png|The main tab for a local Rhino launch configuration | ||
| + | </gallery> | ||
| + | |||
| + | == Include Paths == | ||
The '''Include''' tab for a Rhino configuration allows you to quickly and easily add additional scripts to be run before the main script. | The '''Include''' tab for a Rhino configuration allows you to quickly and easily add additional scripts to be run before the main script. | ||
You have the option to add one or more scripts from the workspace or from the local or extended file system. | You have the option to add one or more scripts from the workspace or from the local or extended file system. | ||
| − | |||
| − | |||
| − | |||
| − | |||
Using the '''Up''' and '''Down''' buttons you can place the scripts in the order you would like them to be run. The script at the top of the listing will be run first. You can also use the '''Remove''' button to remove the selected included scripts from the listing. | Using the '''Up''' and '''Down''' buttons you can place the scripts in the order you would like them to be run. The script at the top of the listing will be run first. You can also use the '''Remove''' button to remove the selected included scripts from the listing. | ||
Any scripts that are added to the include path also have their containing folder automatically added to the source lookup path. For example if you added the script <code>/home/user/myscript.js</code> to the include path, the folder entry for <code>/home/user/</code> would be added to the source lookup path for you automatically. | Any scripts that are added to the include path also have their containing folder automatically added to the source lookup path. For example if you added the script <code>/home/user/myscript.js</code> to the include path, the folder entry for <code>/home/user/</code> would be added to the source lookup path for you automatically. | ||
| − | |||
| − | |||
| − | |||
| − | |||
<gallery widths="340px" heights="260px" perrow="1"> | <gallery widths="340px" heights="260px" perrow="1"> | ||
| − | Image: | + | Image:Local_rhino_include.png|The include tab for a local Rhino launch configuration |
</gallery> | </gallery> | ||
| + | |||
| + | == Source Lookup == | ||
| + | |||
| + | The '''Source''' tab allows you to customize where the launch will look for your source. This tab is automatically updated to track the script specified on the '''Main''' tab as well as entries on the '''Include''' tab. | ||
Any automatically added entries can be changed / removed as you like and and new entries can be added from one of the following locations: | Any automatically added entries can be changed / removed as you like and and new entries can be added from one of the following locations: | ||
| Line 68: | Line 64: | ||
To modify the source lookup path simply use the '''Add...''', '''Remove...''' or '''Edit...''' buttons. The <code>Default</code> project source lookup entry cannot be modified, as it it directly tied to the script specified on the '''Main''' tab. But you can modify and edit any child entries of the <code>Default</code> project entry. | To modify the source lookup path simply use the '''Add...''', '''Remove...''' or '''Edit...''' buttons. The <code>Default</code> project source lookup entry cannot be modified, as it it directly tied to the script specified on the '''Main''' tab. But you can modify and edit any child entries of the <code>Default</code> project entry. | ||
| − | == Embedding the Rhino Debugger = | + | <gallery widths="340px" heights="260px" perrow="1"> |
| + | Image:Local_rhino_source.png|The source tab for a local Rhino launch configuration | ||
| + | </gallery> | ||
| + | |||
| + | = Embedding the Rhino Debugger = | ||
| + | |||
One of the more powerful usages of the Rhino debug support is that it can easily be embedded into your existing server. Embedding | One of the more powerful usages of the Rhino debug support is that it can easily be embedded into your existing server. Embedding | ||
the Rhino Debugger allows you to remotely debug the loading and execution of scripts from the Eclipse IDE. | the Rhino Debugger allows you to remotely debug the loading and execution of scripts from the Eclipse IDE. | ||
| Line 74: | Line 75: | ||
To learn how to embed the Rhino Debugger please go to [[JSDT/Debug/Embedding_Rhino_Debugger|this page]]. | To learn how to embed the Rhino Debugger please go to [[JSDT/Debug/Embedding_Rhino_Debugger|this page]]. | ||
| − | + | = Rhino Debug Wire Protocol = | |
To provide support for the Rhino interpreter, we had to create both sides of the coin - the debugger and the client. To facilitate communication between the debugger and the client we created an adapted version of v8 (JSON-based) packet communication. | To provide support for the Rhino interpreter, we had to create both sides of the coin - the debugger and the client. To facilitate communication between the debugger and the client we created an adapted version of v8 (JSON-based) packet communication. | ||
The complete specification for the [[JSDT/Debug/Rhino_Debug_Wire_Protocol|RDWP]] can be found [[JSDT/Debug/Rhino_Debug_Wire_Protocol|here]]. | The complete specification for the [[JSDT/Debug/Rhino_Debug_Wire_Protocol|RDWP]] can be found [[JSDT/Debug/Rhino_Debug_Wire_Protocol|here]]. | ||
Revision as of 16:58, 14 January 2011
| JSDT Debug | |
| Website | |
| Download | |
| Community | |
| Mailing List • Forums • IRC • mattermost | |
| Issues | |
| Open • Help Wanted • Bug Day | |
| Contribute | |
| Browse Source • Project Set File |
Contents
Overview
Support for the Rhino JavaScript interpreter is available in the JSDT feature and is provided to allow local and remote debugging of JavaScript using Rhino.
The bundles provided by JSDT debug for the Rhino support include:
org.eclipse.wst.jsdt.debug.rhino- the core Rhino implementation, provides the Rhino-specific implementation of JSDIorg.eclipse.wst.jsdt.debug.rhino.ui- the Rhino-specific user interface bitsorg.eclipse.wst.jsdt.debug.rhino.debugger- the Rhino debugger that can be embedded in a server for remote debugging
Local Rhino Debugging
New to 1.3 is the ability to locally launch and debug JavaScript file(s) using Rhino. This new launching support includes context-sensitive launching from the platform and automatic source / script path updating.
The related New and Noteworthy entry is here.
Launch Options
The options on the Main tab allow you to specify the script you want to debug and the parameters use to configure the Rhino interpreter. The default options specified for a new configuration will provide you with the most general debugging experience, but you can tailor how the interpreter runs to reproduce specific scenarios.
There are a few options for Rhino which are as follows:
Script- The script option is required and points to the JavaScript file in you workspace that you wish to debug. The file is checked for existence, so a manually entered path will be validated
ECMA script version to interpret with- This option allows you to set the ECMA compliance level that Rhino will interpret the script using. For more information on how Rhino uses this option see this link about the option to Rhino and this link about JavaScript language levels.
Rhino optimization level- Rhino can make certain optimizations when it interprets the script. To find out more about what each optimization means / does check this link.
Strict mode- This option puts Rhino in strict mode. When in strict mode Rhino will treat some warnings as errors and will report all warnings. It can be a challenge to debug scripts in strict mode, as many more problems are found, most of which terminate interpreting the script.
Log interpreter exceptions- In certain cases, usually a fatal problem from the interpreter, exceptions will be thrown from Rhino. This option allows them to be forwarded to the Eclipse error log.
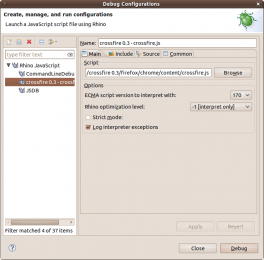
The main tab for a local Rhino launch configuration

Include Paths
The Include tab for a Rhino configuration allows you to quickly and easily add additional scripts to be run before the main script.
You have the option to add one or more scripts from the workspace or from the local or extended file system.
Using the Up and Down buttons you can place the scripts in the order you would like them to be run. The script at the top of the listing will be run first. You can also use the Remove button to remove the selected included scripts from the listing.
Any scripts that are added to the include path also have their containing folder automatically added to the source lookup path. For example if you added the script /home/user/myscript.js to the include path, the folder entry for /home/user/ would be added to the source lookup path for you automatically.
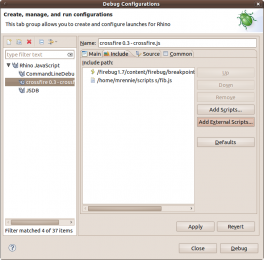
The include tab for a local Rhino launch configuration

Source Lookup
The Source tab allows you to customize where the launch will look for your source. This tab is automatically updated to track the script specified on the Main tab as well as entries on the Include tab.
Any automatically added entries can be changed / removed as you like and and new entries can be added from one of the following locations:
- Archive
- External Archive
- File System Directory
- Java Classpath Variable
- Java Library
- Java Project
- Project
- Working Set
- Workspace
- Workspace Folder
To modify the source lookup path simply use the Add..., Remove... or Edit... buttons. The Default project source lookup entry cannot be modified, as it it directly tied to the script specified on the Main tab. But you can modify and edit any child entries of the Default project entry.
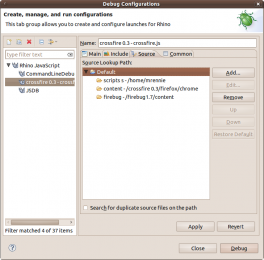
The source tab for a local Rhino launch configuration

Embedding the Rhino Debugger
One of the more powerful usages of the Rhino debug support is that it can easily be embedded into your existing server. Embedding the Rhino Debugger allows you to remotely debug the loading and execution of scripts from the Eclipse IDE.
To learn how to embed the Rhino Debugger please go to this page.
Rhino Debug Wire Protocol
To provide support for the Rhino interpreter, we had to create both sides of the coin - the debugger and the client. To facilitate communication between the debugger and the client we created an adapted version of v8 (JSON-based) packet communication.