Notice: this Wiki will be going read only early in 2024 and edits will no longer be possible. Please see: https://gitlab.eclipse.org/eclipsefdn/helpdesk/-/wikis/Wiki-shutdown-plan for the plan.
Difference between revisions of "Epidemiological Parameters"
(→Example 2: Infectious Mortality Rate) |
m (→Example 2: Infectious Mortality Rate) |
||
| Line 49: | Line 49: | ||
ξ = 0.5/10 days = 0.05 [days<sup>-1</sup>] | ξ = 0.5/10 days = 0.05 [days<sup>-1</sup>] | ||
In general, since the '''recovery rate''' (γ) ≡ '''1/period of infection''' then the infectious mortality rate | In general, since the '''recovery rate''' (γ) ≡ '''1/period of infection''' then the infectious mortality rate | ||
| − | &xi = '''CFR''' * γ | + | ξ = '''CFR''' * γ |
Revision as of 16:23, 9 April 2015
About Epidemiological Parameters
Common Variables and their Units
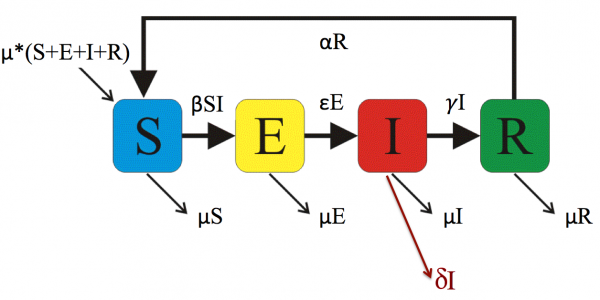
Using an SEIR model as an example lets discuss some common epidemiological parameters and what they mean. The figure shows the compartments for S=Susceptible, E=Exposed (but not yet infectious), I=Infectious (Shedding Virus), R=Recovered. The arrows show the transitions or people moving between the compartments in a specified time interval. See the page on compartment models.
What they mean
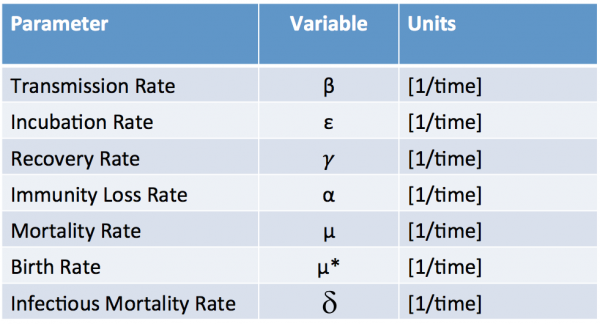
The table below shows the epidemiological parameters for the SEIR model shown above. Note that the UNITS or all or the parameters are inverse time.
 Figure 1: SEIR Compartment Model
Each of the parameters are rate constants, but the transmission rate β. has a special role in that it appears inside the mass action term. This interaction term has the product SI.
If the compartments are all normalize so that the total population S+E+I+R = 1
then Susceptible individuals become exposed at a rate, β. SI
For S+E+I+R = P, we have
Common Questions
All of the parameters defined above (and as used in STEM) are rate constants so their values depend on the user specified time period.
Example 1: Mortality Rate
The mortality rate μ represents the rate at which individuals die even with no disease.
For a constant population the mortality rate = the birth rate (or μ=μ*).
For humans, if the average life span is 50 years, and if the time period is 1 day, then
μ = (1/50 years) * (1 year/365.25 days) = (1/18262.5 days)
or
μ = 5.476 x 10⁻⁵[days-1].
Example 2: Infectious Mortality Rate
The infectious mortality rate ξ represents the rate at which infected people die. It is not to be confused with
the net case fatality rate (CFR).
Consider, for example, a virulent disease that has a CFR of 0.5 (50% of people infected
people die), and a Period of Infection of 10 days. Then the infectious mortality rate
ξ = 0.5/10 days = 0.05 [days-1]
In general, since the recovery rate (γ) ≡ 1/period of infection then the infectious mortality rate
ξ = CFR * γ


