Notice: this Wiki will be going read only early in 2024 and edits will no longer be possible. Please see: https://gitlab.eclipse.org/eclipsefdn/helpdesk/-/wikis/Wiki-shutdown-plan for the plan.
Difference between revisions of "Epidemic View"
(→Viewing Data From an Existing Epidemic Scenario) |
|||
| (6 intermediate revisions by 2 users not shown) | |||
| Line 1: | Line 1: | ||
| + | [[Image:STEM TOP BAR.gif]] | ||
| + | |||
| + | '''[http://wiki.eclipse.org/Tutorials_for_Developers Back]''' | ||
| + | |||
== Introduction == | == Introduction == | ||
| Line 5: | Line 9: | ||
== Viewing Data From an Existing Epidemic Scenario == | == Viewing Data From an Existing Epidemic Scenario == | ||
| − | + | # Enter the [[Analysis]] Perspective | |
| − | + | # Click on the Epidemic Tab | |
| − | + | # Use the Select Folder button to chose the folder containing the epidemic data you wish to study. The files should have the following [[Importing Data from Files|format]]. | |
| − | + | # Click Aggregate Data. This will automatically create two aggregated data files based on the data in the original scenario folder. These file names will appear in the text fields for Scenario Aggregate File and Scenario Incidence file. The aggregated data will be written to the 'aggregate' and 'incidence' subfolders respectively (these will be created if they do not exist). The files will be named based on the input disease name. The aggregate data is the running integral or sum over time of all compartment data (S,E,I,R) over all locations in the input scenario folder. The incidence data contains differential data including incidence (new cases at time t),new births, deaths, etc. Incidence data will be estimated if it does not exist in the original scenario data files. Note, if you already have aggregate data you can also input these files manually. | |
| − | + | # On the left hand side the Epidemic view will show the integrated state data (S,E,I,R, etc). Differential data will appear on the right hand chart. To toggle between linear and logarithmic scales or to change what variables are plotted just right click and use the custom dialog that will appear. | |
| − | + | ||
| − | + | ||
| − | + | ||
| − | + | ||
| − | + | ||
| − | + | ||
| − | + | ||
| − | + | ||
| − | + | ||
| − | + | ||
| − | + | ||
| − | + | ||
[[Image:Epidemic.jpg]] | [[Image:Epidemic.jpg]] | ||
Latest revision as of 18:19, 1 October 2009
Introduction
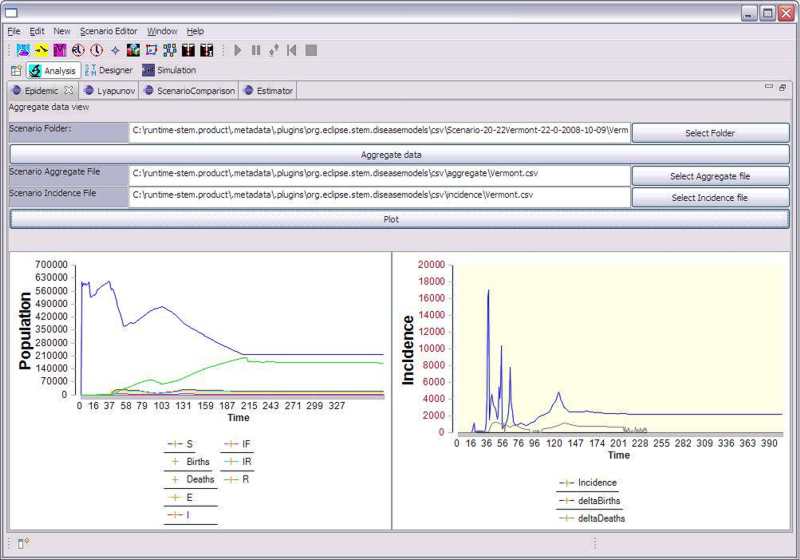
STEM provides an Epidemic Analysis tool for users to study results of a previous run and to analyze the resulting epidemic. The Epidemic View can also be used to analyze imported data.
Viewing Data From an Existing Epidemic Scenario
- Enter the Analysis Perspective
- Click on the Epidemic Tab
- Use the Select Folder button to chose the folder containing the epidemic data you wish to study. The files should have the following format.
- Click Aggregate Data. This will automatically create two aggregated data files based on the data in the original scenario folder. These file names will appear in the text fields for Scenario Aggregate File and Scenario Incidence file. The aggregated data will be written to the 'aggregate' and 'incidence' subfolders respectively (these will be created if they do not exist). The files will be named based on the input disease name. The aggregate data is the running integral or sum over time of all compartment data (S,E,I,R) over all locations in the input scenario folder. The incidence data contains differential data including incidence (new cases at time t),new births, deaths, etc. Incidence data will be estimated if it does not exist in the original scenario data files. Note, if you already have aggregate data you can also input these files manually.
- On the left hand side the Epidemic view will show the integrated state data (S,E,I,R, etc). Differential data will appear on the right hand chart. To toggle between linear and logarithmic scales or to change what variables are plotted just right click and use the custom dialog that will appear.


