Notice: this Wiki will be going read only early in 2024 and edits will no longer be possible. Please see: https://gitlab.eclipse.org/eclipsefdn/helpdesk/-/wikis/Wiki-shutdown-plan for the plan.
COSMOS Design 214145
Back to Data Reporting Design
Contents
Change History
| Name: | Date: | Revised Sections: |
|---|---|---|
| Sheldon Lee-Loy | 01/07/2008 |
|
Workload Estimation
| Process | Sizing | Names of people doing the work |
|---|---|---|
| Design | 0.2 | Sheldon Lee-Loy |
| Code | 2 | |
| Test | 0.5 | |
| Documentation | 0.5 | |
| Build and infrastructure | 0.2 | |
| Code review, etc.* | ||
| TOTAL | 3.4 |
'* - includes other committer work (e.g. check-in, contribution tracking)
Purpose
A simple generic graph response view is needed catered towards users that are not familiar with CMDBf schemas. This will allow end users to understand and analyze the data easier instead of trying to navigate an XML structure. This view will be used as a default view for the COSMOS UI. This view should be able to render the contents of any graph response in a generic way. There should be extension points to customize the specific contents of the graph response.
Requirement
A table is a likely generic view since users at a glance can determine the number of records in the graph response. A table can scale the cmdbf query response better than a tree since the graph response will most likely be root level heavy (i.e. the tree will contain a large number of root notes rather than many leaf nodes).
As a stretch goal a tool bar should be provided that provides filtering and searching capability. Searching capability may be complicated. Filtering capability can be the definition of a cmdbf query.
Design
Let us first consider the structure of the CMDBf graph response.
<queryResult>
   <nodes templateId="xs:ID">
      <item>
        <record>
        xs:any
           <recordMetadata>
              <recordId>...</recordId>
              <lastModified>...</lastModified> ?
              <baselineId>...</baselineId> ?
              <snapshotId>...</snapshotId> ?
              xs:any
           </recordMetadata>
        </record> *
         <instanceId>
            <mdrId>xs:anyURI</mdrId>
            <localId>xs:anyURI</localId>
         </instanceId> +
         <additionalRecordType namespace="xs:anyURI" localName="xs:NCName"/> *
      </item> +
    </nodes> *
    <edges templateId="xs:ID">
       <relationship>
          <source>
             <mdrId>xs:anyURI</mdrId>
             <localId>xs:anyURI</localId>
          </source>
          <target>
             <mdrId>xs:anyURI</mdrId>
             <localId>xs:anyURI</localId>
          </target>
          <record>
             xs:any
             <recordMetadata>
                <recordId>...</recordId>
                <lastModified>...</lastModified> ?
                <baselineId>...</baselineId> ?
                <snapshotId>...</snapshotId> ?
             </recordMetadata>
          </record> *
          <instanceId>
             <mdrId>xs:anyURI</mdrId>
             <localId>xs:anyURI</localId>
          </instanceId> +
          <additionalRecordType namespace="xs:anyURI" localName="xs:NCName"/> *
       </relationship> +
    </edges> *
</queryResult>
As stated in the CMDBf 1.0 specification document the graph response is made up of <nodes> and <edges> elements. Each of these elements have an associated 'templateId' attribute that corresponds to the 'templateId' attribute used to construct the CMDBf query.
Creating a tab layout will improve the visualization of the node and edge elements. A tab can be constructed for each node or element. The title of the tab will correspond to the templateId. This will logically separate the edge and node contents. Color coding or icons can be used to distinguish between a node or edge.
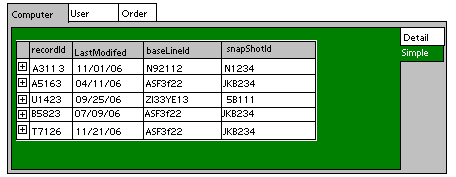
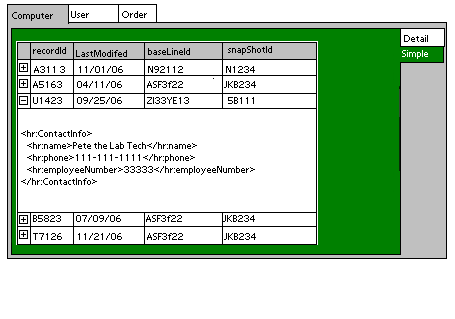
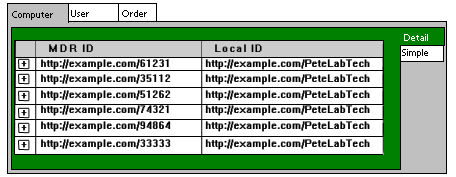
Each tab will contain a table that will show the contents of the node or edge. There will be two version of the the table. There will be a detail table and simple table. The simple table will show a list of record meta data. Each row can expand to show the contents of the record. The detail table will show all the information capture in the CMDBf response structure.
Simple Table Mockup
The simple table view will only show record information. That is, it will only show the record contents and record meta data for each node and edge. Note that the node and edges are shown as the top level tabs.
Simple view with rows collapsed
Simple view with rows expanded. The user is able to see the contents of the record. An extension point will be provided to create custom rendering for a record row.
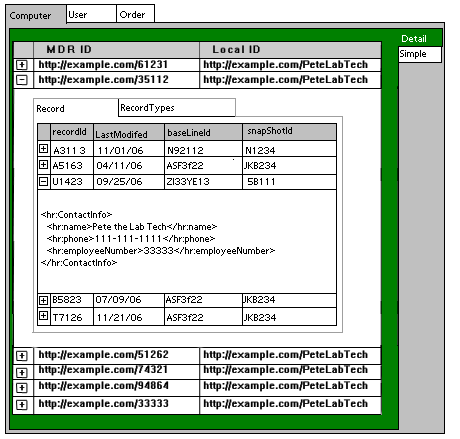
Detail Table Mockup
The details view will show more details of the graph response such as item and relationship information.
Detail view with rows collapsed. Each row will represent an item if node information is shown. In contrast, if edge information is shown each row will correspond to a relationship. Note that the above mockup shows only items. If relationships were shown the source and target information would be added as additional columns in the table.
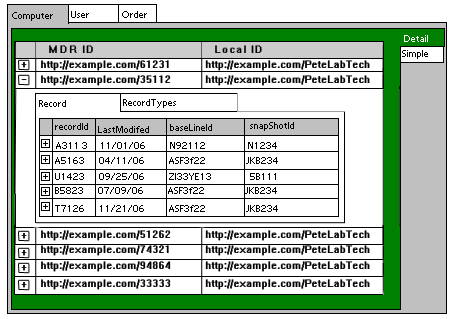
Detail view with item rows expanded. The expanded row will show the list of records associated with an item or relationship.
Detail view with record rows expanded.
Widget Design
The CMDBf graph response widget is constructed from several simple widgets. The following shows the hierarchy of widgets:
- Tab Widget - responsible for rendering the top level tabs
- Detail Widget - responsible for rendering the details tab
- Item Widget - responsible for rendering the item table lists in the details view
- Relationship Widget - responsible for rendering the relationship table lists in the details view
- Simple Widget - responsible for rendering the simple tab
- Item Widget - responsible for rendering the item table lists in the simple view
- Relationship Widget - responsible for rendering the relationship table lists in the simple view
- Item Widget - responsible for rendering the item table lists in the simple view
- Detail Widget - responsible for rendering the details tab
- Record Widget - responsible for rendering the record table
For each of the above table a data feed is required to get the header information for the tabs and table. Additional data feeds are required to get the table row content.

