Notice: this Wiki will be going read only early in 2024 and edits will no longer be possible. Please see: https://gitlab.eclipse.org/eclipsefdn/helpdesk/-/wikis/Wiki-shutdown-plan for the plan.
Difference between revisions of "CDT/User/NewIn92"
(→Hide gdb traces by default) |
|||
| Line 40: | Line 40: | ||
=== Full GDB console === | === Full GDB console === | ||
This feature was completed through [https://bugs.eclipse.org/xxxxx Bug xxxxx]. | This feature was completed through [https://bugs.eclipse.org/xxxxx Bug xxxxx]. | ||
| + | |||
| + | === Selection synchronization with GDB === | ||
=== Display GDB thread ids in the Multicore Visualizer === | === Display GDB thread ids in the Multicore Visualizer === | ||
Revision as of 08:55, 11 November 2016
Contents
Release
This is the New & Noteworthy page for CDT 9.2 which is part of the Eclipse Neon.2 update release of December 2016
General
Editor
Makefile Editor
Code Analysis
Parser
Support for C++14 constexpr evaluation
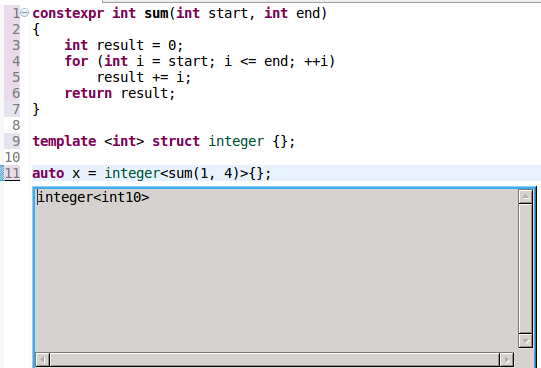
C++14 expanded the scope of what's allowed inside a constexpr function, to allow variable declarations and most control statements such as loops. CDT now supports evaluation of constexpr functions that make use of these features.
In this example, CDT simulates the execution of a constexpr function that contains a for loop to determine that the type of x is integer<10>.
Formatter
Build
Debug
Debugger Console view
Full GDB console
This feature was completed through Bug xxxxx.
Selection synchronization with GDB
Display GDB thread ids in the Multicore Visualizer
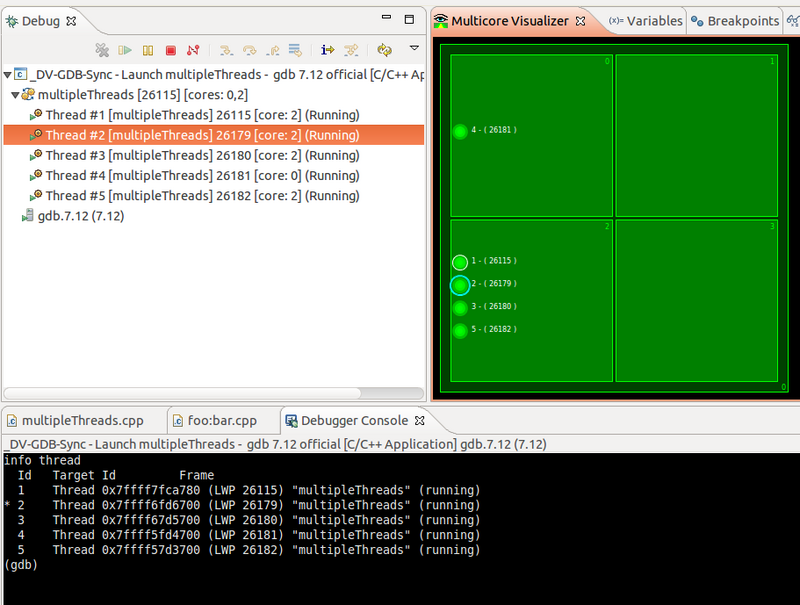
The Multicore Visualizer shows all threads of the process(es) being debugged. Previously, each thread would be represented by a dot followed by the OS thread id of that thread (PID on Linux).
With this enhancement, the GDB thread id is also displayed, making it easier for the user to map the threads in the Visualizer to the threads in the Debug View and in the Debugger Console.
This feature was completed through Bug 501006.
Hide gdb traces by default
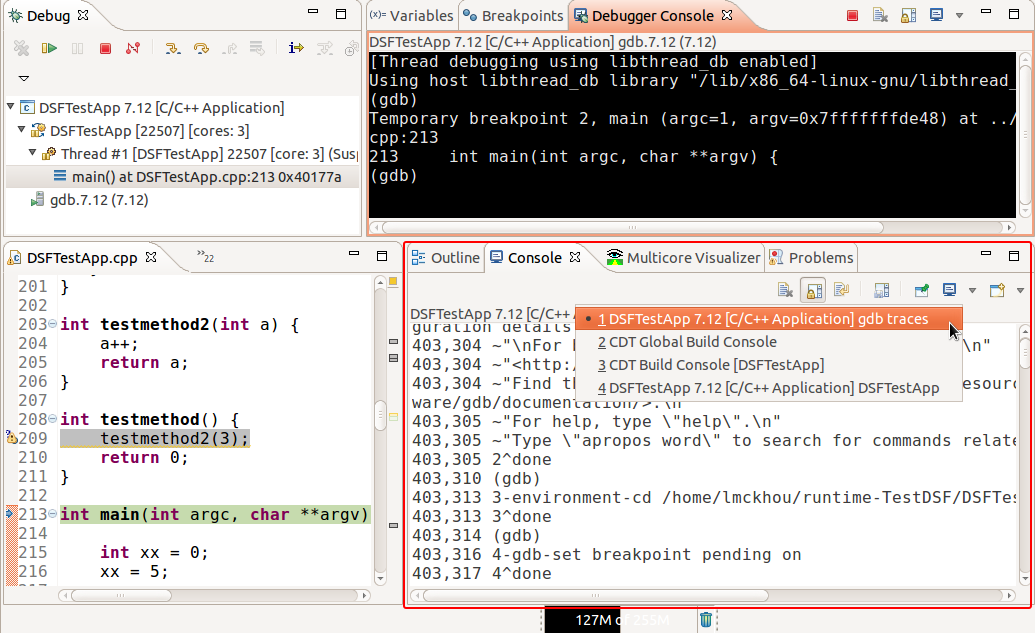
For many releases a dedicated console has been used to display the communication between CDT and GDB when debugging. These traces, referred to as 'gdb traces', are an implementation detail and should not be of interest to the standard user. However, as they provide a very valuable tool for troubleshooting debug issues, they were being displayed by default as safety precaution.
In this release, the 'gdb traces' have been made to be enabled but hidden by default. In this fashion, they will not be visible to the standard user, thus reducing the IDE complexity slightly, but will be available when troubleshooting is required. The below image shows the console when the 'gdb traces' are explicitly made visible by the user through a preference.
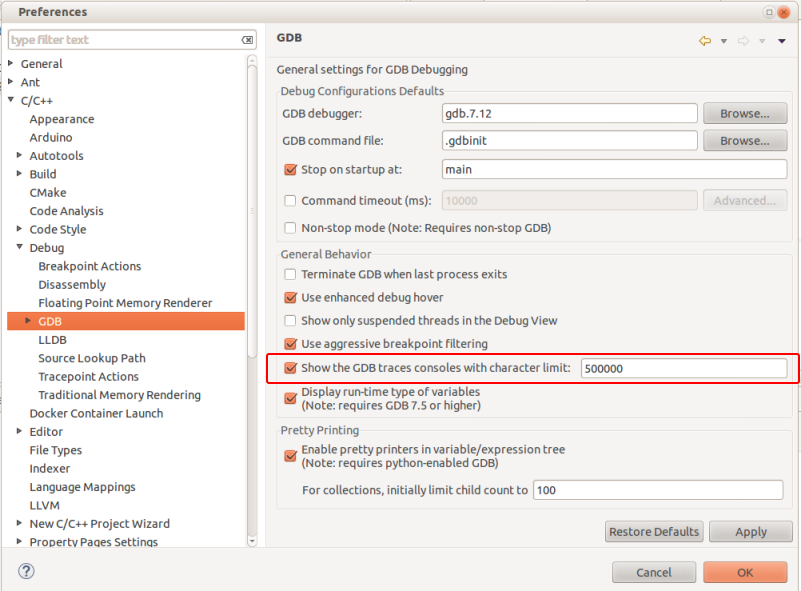
To enable those traces go to Preferences->C/C++->Debug->GDB and enable the preference called "Show the GDB traces consoles". The size of the console buffer can still be set using the corresponding text preference. Note that the GDB traces will always be enabled and be recorded and that the preference in question is only used to display or hide the actual 'gdb traces' console.
Bugs Fixed in this Release
See Bugzilla report Bugs Fixed in CDT 9.2


