Notice: this Wiki will be going read only early in 2024 and edits will no longer be possible. Please see: https://gitlab.eclipse.org/eclipsefdn/helpdesk/-/wikis/Wiki-shutdown-plan for the plan.
Difference between revisions of "CDT/User/NewIn82"
(→Debug) |
m (Added entry describing the floating point renderer added to 8.2) |
||
| Line 1: | Line 1: | ||
== Debug == | == Debug == | ||
| − | === Enhanced Expressions === | + | === Enhanced Expressions === |
| + | |||
| + | The Expressions view has been enhanced to allow the user to manually create the following: | ||
| + | |||
| + | *pattern-matched registers groups, where the symbols * [] ? can be used e.g., | ||
| − | |||
| − | |||
$e?x -- Will show registers starting with 'e' and ending with 'x' with a single character in between | $e?x -- Will show registers starting with 'e' and ending with 'x' with a single character in between | ||
$* -- Will show all registers | $* -- Will show all registers | ||
$*x -- Will show registers ending with 'x' | $*x -- Will show registers ending with 'x' | ||
$st[3-5] -- Will show registers $st3, $st4, $st5 | $st[3-5] -- Will show registers $st3, $st4, $st5 | ||
| − | * a single group, * , showing the local variables | + | |
| + | *a single group, * , showing the local variables | ||
| + | |||
* -- Will show all local variables of the selected stack frame in the Expressions view, as the Variables view does | * -- Will show all local variables of the selected stack frame in the Expressions view, as the Variables view does | ||
| − | * semi-colon-separated groups of expressions, e.g, | + | |
| + | *semi-colon-separated groups of expressions, e.g, | ||
| + | |||
var1; var2 -- Will create a group containing both var1 and var2 | var1; var2 -- Will create a group containing both var1 and var2 | ||
$eax; var1 -- Will show a group containing register $eax and variable var1 | $eax; var1 -- Will show a group containing register $eax and variable var1 | ||
var1; $e* -- Will show a group containing variable var1 as well as all registers starting with 'e' | var1; $e* -- Will show a group containing variable var1 as well as all registers starting with 'e' | ||
| − | This feature allows to quickly define multiple expressions that interest the user. | + | This feature allows to quickly define multiple expressions that interest the user. Because groups are created from these special expressions, they can be collapsed when uninteresting and re-expanded later, without having to be re-entered by the user. |
| − | [[Image: | + | [[Image:CDT GroupExpr.png]] |
| − | This feature was completed on July 10th, 2012. For details see [http://bugs.eclipse.org/381754 Bug 381754]. | + | This feature was completed on July 10th, 2012. For details see [http://bugs.eclipse.org/381754 Bug 381754]. For more details, please refer to the [[CDT/EnhancedExpressions|Enhanced Expressions description]]. |
| − | Note that the comma (,) is not allowed as a group separator as it is used within valid expressions that use templates (e.g., ''((((((class std::_Vector_base | + | Note that the comma (,) is not allowed as a group separator as it is used within valid expressions that use templates (e.g., ''((((((class std::_Vector_base<int, std::allocator<int> >) v))._M_impl))._M_start)''). |
| − | === OS Resources View === | + | === OS Resources View === |
| − | CDT has a new view called "OS Resources". | + | CDT has a new view called "OS Resources". This view will display different information about the resources of the operating system. For example, it can give a list of all processes running on the target. The view will display the information as provided by GDB. |
| − | [[Image:CDT OSResources.png]] | + | [[Image:CDT OSResources.png]] |
| + | |||
| + | As of writing, GDB supported the following information: | ||
| − | |||
Processes - Listing of all processes | Processes - Listing of all processes | ||
Process groups - Listing of all process groups | Process groups - Listing of all process groups | ||
| Line 41: | Line 48: | ||
Kernel modules - Listing of all loaded kernel modules | Kernel modules - Listing of all loaded kernel modules | ||
| + | <br> Notes: | ||
| − | + | *For performance reasons, the view is not automatically refreshed. Press the ''Refresh'' button on the the view toolbar to fetch the latest information. Hovering over this ''Refresh'' button will display the time at which the information was last obtained. | |
| − | * For performance reasons, the view is not automatically refreshed. | + | *Columns can be re-sized. |
| − | * Columns can be re-sized. | + | *Columns can be removed or added using the view menu. |
| − | * Columns can be removed or added using the view menu. | + | *Entries can be ordered by column by pressing on the column header. |
| − | * Entries can be ordered by column by pressing on the column header. | + | *When doing debugging of a remote target, the information in the view pertains to the remote target. |
| − | * When doing debugging of a remote target, the information in the view pertains to the remote target. | + | |
| − | This feature requires GDB 7.5 and higher. | + | This feature requires GDB 7.5 and higher. Furthermore, as of GDB 7.5, this feature only works for Linux. |
| − | This feature was completed on September 20th, 2012. For details see [https://bugs.eclipse.org/360314 Bug 360314]. | + | This feature was completed on September 20th, 2012. For details see [https://bugs.eclipse.org/360314 Bug 360314]. |
| − | === Breakpoint Filtering === | + | === Breakpoint Filtering === |
| − | The CDT has enhanced the standard behavior of the "Show Breakpoints Supported by Selected Target" option of the Breakpoints view. | + | The CDT has enhanced the standard behavior of the "Show Breakpoints Supported by Selected Target" option of the Breakpoints view. Using this option with the CDT will now only show breakpoints that are actually applicable to the current debug session. Therefore, when debugging a C/C++ application, the user will not be bothered with the breakpoints set in the code of an another C/C++ application. |
| − | with the breakpoints set in the code of an another C/C++ application. | + | |
| − | [[Image:BpFilter.png]] | + | [[Image:BpFilter.png]] |
| − | For backwards-compatibility, a preference is provided to revert this new behavior to the original one. | + | For backwards-compatibility, a preference is provided to revert this new behavior to the original one. The original behavior of this option is to have the Breakpoints view show all breakpoints that are of the same type as the current debug session. For example, if debugging Java, only Java breakpoints would be shown, and if debugging C/C++ only C/C++ breakpoints would be shown. This preference can be found under ''"C/C++ -> Debug -> GDB -> Use aggressive breakpoint filtering"''. |
| − | This feature was completed on October 26th, 2012. For details see [https://bugs.eclipse.org/360735 Bug 360735]. | + | This feature was completed on October 26th, 2012. For details see [https://bugs.eclipse.org/360735 Bug 360735]. |
| − | === Enhanced GDB console support for breakpoints, watchpoints and tracepoints === | + | === Enhanced GDB console support for breakpoints, watchpoints and tracepoints === |
| − | Breakpoints, watchpoints or tracepoints set from the GDB console are now shown in the Breakpoints view. All breakpoint related GDB commands are supported and synchronized with the UI. No support for catchpoints yet. This feature requires GDB 7.4 and higher. | + | Breakpoints, watchpoints or tracepoints set from the GDB console are now shown in the Breakpoints view. All breakpoint related GDB commands are supported and synchronized with the UI. No support for catchpoints yet. This feature requires GDB 7.4 and higher. |
| − | This feature was completed on November 29th, 2012. For details see [https://bugs.eclipse.org/392512 Bug 392512]. | + | This feature was completed on November 29th, 2012. For details see [https://bugs.eclipse.org/392512 Bug 392512]. |
== Other == | == Other == | ||
| + | |||
| + | === Floating Point renderer has been added to the memory package === | ||
| + | |||
| + | A floating point render has been added to the memory package. So now there is the Traditional renderer and a Floating Point renderer available. | ||
| + | This render allows display and editing of the floating point values. Since it originated from the Traditional render, it's workflow and style are similar. There is no ASCII data pane display, since this did not seem to make much sense with floating point data. | ||
Revision as of 10:39, 30 November 2012
Contents
Debug
Enhanced Expressions
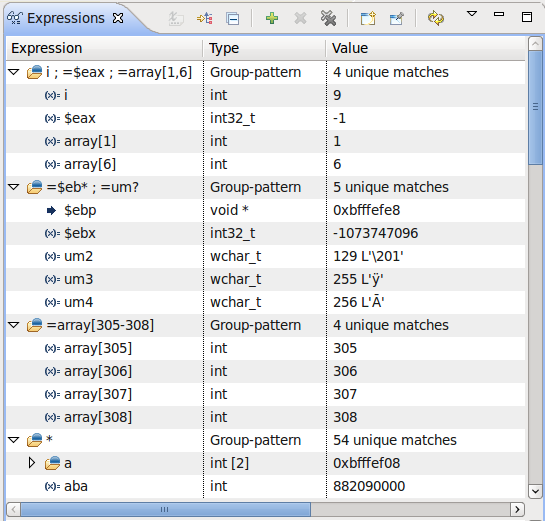
The Expressions view has been enhanced to allow the user to manually create the following:
- pattern-matched registers groups, where the symbols * [] ? can be used e.g.,
$e?x     -- Will show registers starting with 'e' and ending with 'x' with a single character in between
$*       -- Will show all registers
$*x      -- Will show registers ending with 'x'
$st[3-5] -- Will show registers $st3, $st4, $st5
- a single group, * , showing the local variables
* -- Will show all local variables of the selected stack frame in the Expressions view, as the Variables view does
- semi-colon-separated groups of expressions, e.g,
var1; var2 -- Will create a group containing both var1 and var2
$eax; var1 -- Will show a group containing register $eax and variable var1
var1; $e*  -- Will show a group containing variable var1 as well as all registers starting with 'e'
This feature allows to quickly define multiple expressions that interest the user. Because groups are created from these special expressions, they can be collapsed when uninteresting and re-expanded later, without having to be re-entered by the user.
This feature was completed on July 10th, 2012. For details see Bug 381754. For more details, please refer to the Enhanced Expressions description.
Note that the comma (,) is not allowed as a group separator as it is used within valid expressions that use templates (e.g., ((((((class std::_Vector_base<int, std::allocator<int> >) v))._M_impl))._M_start)).
OS Resources View
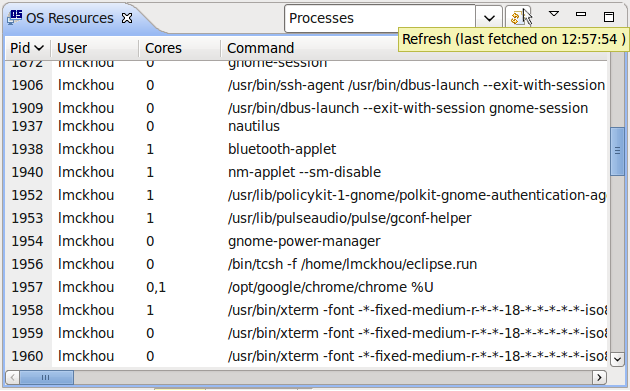
CDT has a new view called "OS Resources". This view will display different information about the resources of the operating system. For example, it can give a list of all processes running on the target. The view will display the information as provided by GDB.
As of writing, GDB supported the following information:
Processes             - Listing of all processes
Process groups        - Listing of all process groups
Threads               - Listing of all threads
File descriptors      - Listing of all file descriptors
Sockets               - Listing of all internet-domain sockets
Shared-memory regions - Listing of all shared-memory regions
Semaphores            - Listing of all semaphores
Message queues        - Listing of all message queues
Kernel modules        - Listing of all loaded kernel modules
Notes:
- For performance reasons, the view is not automatically refreshed. Press the Refresh button on the the view toolbar to fetch the latest information. Hovering over this Refresh button will display the time at which the information was last obtained.
- Columns can be re-sized.
- Columns can be removed or added using the view menu.
- Entries can be ordered by column by pressing on the column header.
- When doing debugging of a remote target, the information in the view pertains to the remote target.
This feature requires GDB 7.5 and higher. Furthermore, as of GDB 7.5, this feature only works for Linux.
This feature was completed on September 20th, 2012. For details see Bug 360314.
Breakpoint Filtering
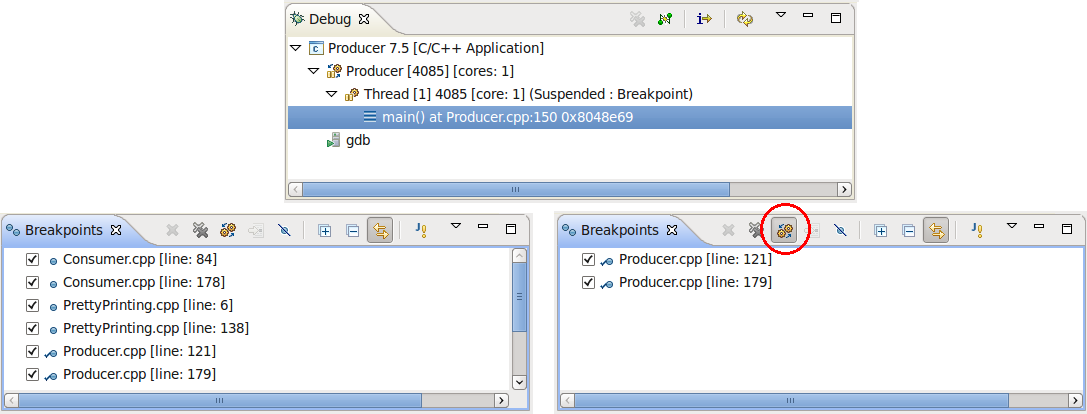
The CDT has enhanced the standard behavior of the "Show Breakpoints Supported by Selected Target" option of the Breakpoints view. Using this option with the CDT will now only show breakpoints that are actually applicable to the current debug session. Therefore, when debugging a C/C++ application, the user will not be bothered with the breakpoints set in the code of an another C/C++ application.
For backwards-compatibility, a preference is provided to revert this new behavior to the original one. The original behavior of this option is to have the Breakpoints view show all breakpoints that are of the same type as the current debug session. For example, if debugging Java, only Java breakpoints would be shown, and if debugging C/C++ only C/C++ breakpoints would be shown. This preference can be found under "C/C++ -> Debug -> GDB -> Use aggressive breakpoint filtering".
This feature was completed on October 26th, 2012. For details see Bug 360735.
Enhanced GDB console support for breakpoints, watchpoints and tracepoints
Breakpoints, watchpoints or tracepoints set from the GDB console are now shown in the Breakpoints view. All breakpoint related GDB commands are supported and synchronized with the UI. No support for catchpoints yet. This feature requires GDB 7.4 and higher.
This feature was completed on November 29th, 2012. For details see Bug 392512.
Other
Floating Point renderer has been added to the memory package
A floating point render has been added to the memory package. So now there is the Traditional renderer and a Floating Point renderer available. This render allows display and editing of the floating point values. Since it originated from the Traditional render, it's workflow and style are similar. There is no ASCII data pane display, since this did not seem to make much sense with floating point data.


