Notice: this Wiki will be going read only early in 2024 and edits will no longer be possible. Please see: https://gitlab.eclipse.org/eclipsefdn/helpdesk/-/wikis/Wiki-shutdown-plan for the plan.
Difference between revisions of "CDT/User/NewIn82"
(→Step Into Selection) |
|||
| Line 83: | Line 83: | ||
[[Image:CDT GroupExpr.png]] | [[Image:CDT GroupExpr.png]] | ||
| − | This feature was completed | + | This feature was completed through [http://bugs.eclipse.org/381754 Bug 381754] and [http://bugs.eclipse.org/394408 Bug 394408]. |
Note that the comma (,) is not allowed as a group separator as it is used within valid expressions that use templates (e.g., ''((((((class std::_Vector_base<int, std::allocator<int> >) v))._M_impl))._M_start)''). | Note that the comma (,) is not allowed as a group separator as it is used within valid expressions that use templates (e.g., ''((((((class std::_Vector_base<int, std::allocator<int> >) v))._M_impl))._M_start)''). | ||
| Line 115: | Line 115: | ||
This feature requires GDB 7.5 and higher. Furthermore, as of GDB 7.5, this feature only works for Linux. | This feature requires GDB 7.5 and higher. Furthermore, as of GDB 7.5, this feature only works for Linux. | ||
| − | This feature was completed | + | This feature was completed through [https://bugs.eclipse.org/360314 Bug 360314]. |
=== Breakpoint Filtering === | === Breakpoint Filtering === | ||
| Line 125: | Line 125: | ||
For backwards-compatibility, a preference is provided to revert this new behavior to the original one. The original behavior of this option is to have the Breakpoints view show all breakpoints that are of the same type as the current debug session. For example, if debugging Java, only Java breakpoints would be shown, and if debugging C/C++ only C/C++ breakpoints would be shown. This preference can be found under ''"C/C++ -> Debug -> GDB -> Use aggressive breakpoint filtering"''. | For backwards-compatibility, a preference is provided to revert this new behavior to the original one. The original behavior of this option is to have the Breakpoints view show all breakpoints that are of the same type as the current debug session. For example, if debugging Java, only Java breakpoints would be shown, and if debugging C/C++ only C/C++ breakpoints would be shown. This preference can be found under ''"C/C++ -> Debug -> GDB -> Use aggressive breakpoint filtering"''. | ||
| − | This feature was completed | + | This feature was completed through [https://bugs.eclipse.org/360735 Bug 360735]. |
=== Enhanced GDB console support === | === Enhanced GDB console support === | ||
| Line 135: | Line 135: | ||
Breakpoints, watchpoints or tracepoints set from the GDB console are now shown in the Breakpoints view. All breakpoint related GDB commands are supported and synchronized with the UI. No support for catchpoints yet. This feature requires GDB 7.4 or higher. | Breakpoints, watchpoints or tracepoints set from the GDB console are now shown in the Breakpoints view. All breakpoint related GDB commands are supported and synchronized with the UI. No support for catchpoints yet. This feature requires GDB 7.4 or higher. | ||
| − | This feature was completed | + | This feature was completed through [https://bugs.eclipse.org/392512 Bug 392512]. |
==== Memory and variables ==== | ==== Memory and variables ==== | ||
| Line 141: | Line 141: | ||
Memory and variables modified from the GDB console are now updated in the Memory, Memory Browser, Variables and Expressions views. This feature requires GDB 7.6 or higher. | Memory and variables modified from the GDB console are now updated in the Memory, Memory Browser, Variables and Expressions views. This feature requires GDB 7.6 or higher. | ||
| − | This feature was completed | + | This feature was completed through [https://bugs.eclipse.org/397715 Bug 397715]. |
==== Reverse debugging state ==== | ==== Reverse debugging state ==== | ||
| Line 147: | Line 147: | ||
CDT will now properly update the status of reverse debugging if its state is modified through the GDB console. This feature requires GDB 7.6 or higher. | CDT will now properly update the status of reverse debugging if its state is modified through the GDB console. This feature requires GDB 7.6 or higher. | ||
| − | This feature was completed | + | This feature was completed through [https://bugs.eclipse.org/399163 Bug 399163] |
=== Breakpoint actions to control reverse debugging === | === Breakpoint actions to control reverse debugging === | ||
| Line 163: | Line 163: | ||
Note: For the reverse debug breakpoint actions to work, reverse debugging must be available in the current debug session. For instance, it will not work if the "non-stop" mode is active. | Note: For the reverse debug breakpoint actions to work, reverse debugging must be available in the current debug session. For instance, it will not work if the "non-stop" mode is active. | ||
| − | This feature was completed | + | This feature was completed through [https://bugs.eclipse.org/365776 Bug 365776]. |
=== Floating Point renderer has been added to the memory package === | === Floating Point renderer has been added to the memory package === | ||
| Line 171: | Line 171: | ||
[[Image:CDT FloatingPointMemory.png]] | [[Image:CDT FloatingPointMemory.png]] | ||
| − | This feature was completed | + | This feature was completed through [http://bugs.eclipse.org/394509 Bug 394509]. |
=== Debugging multiple processes within one debug session === | === Debugging multiple processes within one debug session === | ||
| Line 189: | Line 189: | ||
[[Image:CDT_NewExecutableDialog_Remote.png]] | [[Image:CDT_NewExecutableDialog_Remote.png]] | ||
| − | This feature was completed | + | This feature was completed through [https://bugs.eclipse.org/344890 Bug 344890]. |
| Line 209: | Line 209: | ||
| − | This feature was completed | + | This feature was completed through [https://bugs.eclipse.org/396268 Bug 396268]. |
=== Edit Tracepoint on Create === | === Edit Tracepoint on Create === | ||
| Line 249: | Line 249: | ||
[[Image:CDT-DSF-GDB-MulticoreVisualizer-Selection.png]] | [[Image:CDT-DSF-GDB-MulticoreVisualizer-Selection.png]] | ||
| − | This feature was completed | + | This feature was completed through [https://bugs.eclipse.org/404894 Bug 404894]. |
| Line 256: | Line 256: | ||
[[Image:CDT-DSF-GDB-MulticoreVisualizer-Filtering.png]] | [[Image:CDT-DSF-GDB-MulticoreVisualizer-Filtering.png]] | ||
| − | This feature was completed | + | This feature was completed through [https://bugs.eclipse.org/405390 Bug 405390]. |
=== Process exit code shown in console === | === Process exit code shown in console === | ||
| Line 266: | Line 266: | ||
Note that if there is no process console, then no exit code can be displayed. This affects remote debugging and attach debugging. We hope to address this in the next release of CDT. | Note that if there is no process console, then no exit code can be displayed. This affects remote debugging and attach debugging. We hope to address this in the next release of CDT. | ||
| − | This feature was completed | + | This feature was completed through [https://bugs.eclipse.org/402054 Bug 402054]. |
== Important Notes == | == Important Notes == | ||
Revision as of 10:10, 8 January 2015
Contents
- 1 Editor
- 2 Build
- 3 Debug
- 3.1 Enhanced Expressions
- 3.2 OS Resources View
- 3.3 Breakpoint Filtering
- 3.4 Enhanced GDB console support
- 3.5 Breakpoint actions to control reverse debugging
- 3.6 Floating Point renderer has been added to the memory package
- 3.7 Debugging multiple processes within one debug session
- 3.8 Load information in the Multicore Visualizer - CPU/core load meters
- 3.9 Edit Tracepoint on Create
- 3.10 Step Into Selection
- 3.11 Multicore Visualizer enhanced selection and filtering
- 3.12 Process exit code shown in console
- 4 Important Notes
- 5 Bugs Fixed in this Release
Editor
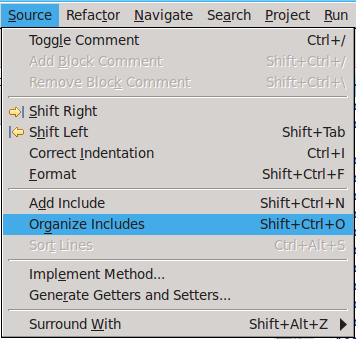
Organize Includes Command
The Organize Includes command is similar to Organize Imports in Java. It adds missing include statements, removes unnecessary ones, and reorders includes according to user preferences.
When determining which header files must be included the Organize Includes command follows the "Include What You Use" rule. See Why Include What You Use? and What Is a Use?.
Build
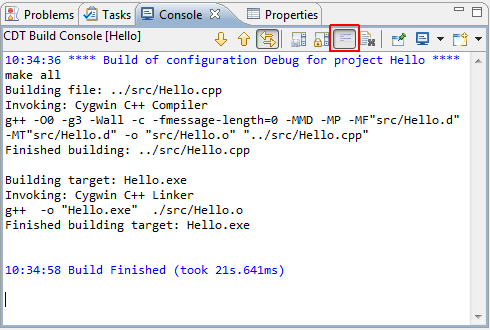
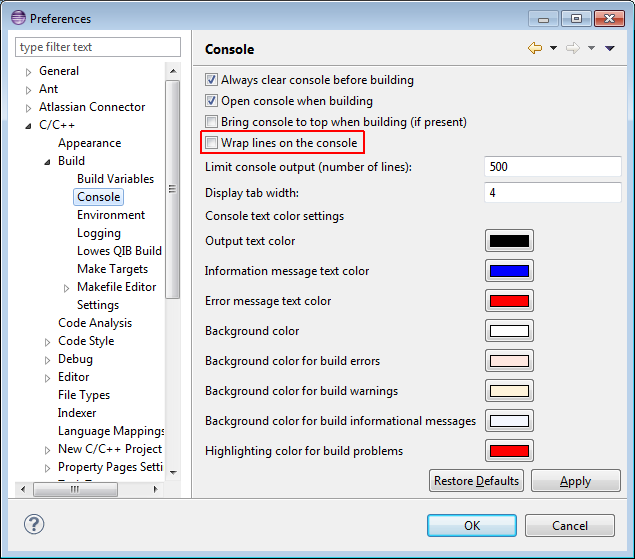
Console
- Line wrap option on the console (Bug 199605).
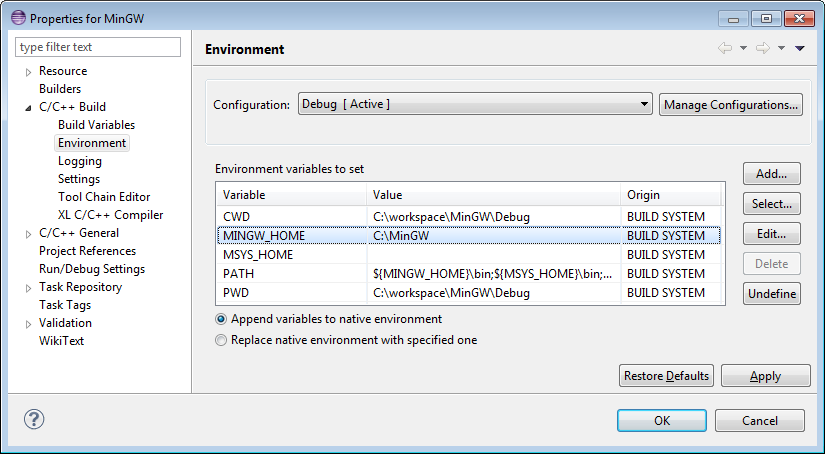
Improved toolchain detection
- Automatic detection of MinGW 64 bit (Bug 380598).
- Detection of Visual Studio under Windows 7 64 bit (Bug 385608).
- Recognize $PATH environment variable from workspace preferences for MinGW and Cygwin toolchains (Bug 384520).
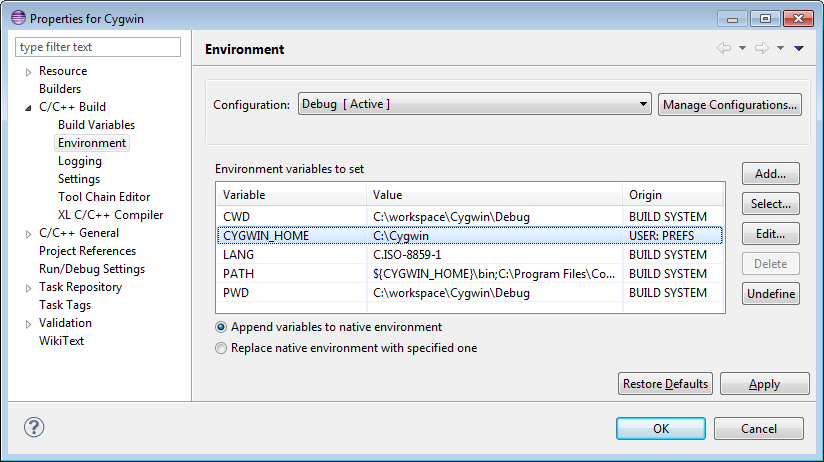
- Introduction of environment variables $MINGW_HOME and $CYGWIN_HOME that are recognized in preferences and project properties (Bug 403257, Bug 357442).
Scanner Discovery / Language Settings Providers
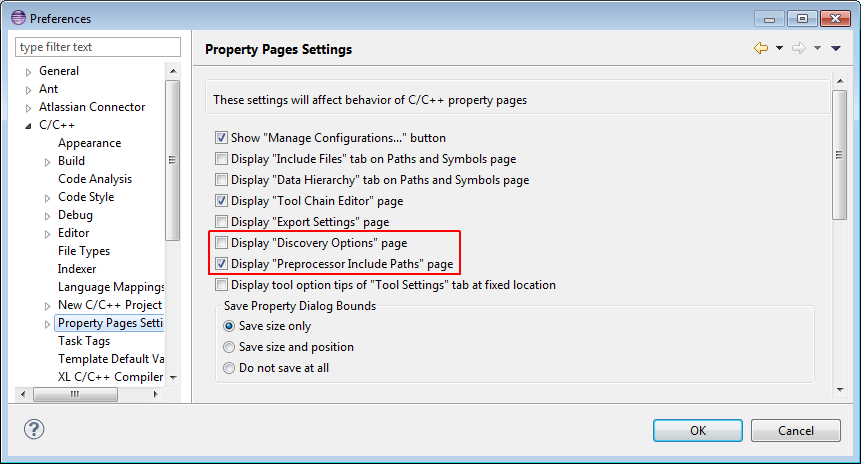
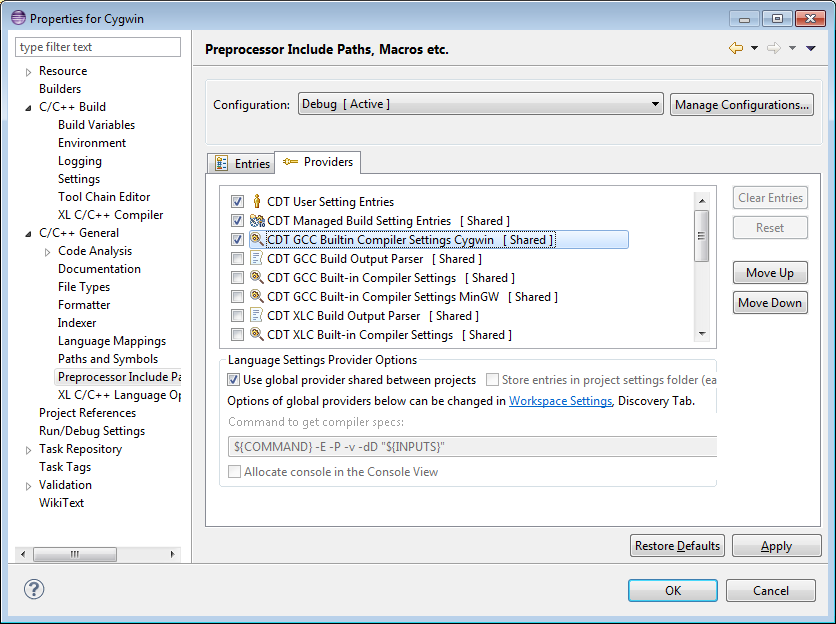
- "Preprocessor Include Paths, Macros etc." property page now fully replaces older "Scanner Discovery" page. "Scanner Discovery" is now hidden by default (Bug 403405, Bug 407087).
- Built-in Compiler Settings provider for MinGW is enabled by default now for MinGW toolchain (Bug 382422).
- Added Built-in Compiler Settings provider for Cygwin (Bug 382423).
- Project-relative include paths representation was stabilized and now officially supported in UI (Bug 401734).
- Support for project-relative paths for Build Output Providers (Bug 402023).
- Changes in environment variables (preferences or project properties - as applicable) automatically trigger re-discovery (Bug 403406).
- Number of changes to support compatibility with older methods to provide include paths for indexer, namely pathEntryContainers, contributed ScannerInfo entries (Bug 401961, Bug 398056, Bug 392966).
- Fixed compatibility issues related to import older projects (Bug 393641).
Makefile Editor
- GNU Makefile functions highlighting fixed (Bug 406911).
- Bracket matching (Bug 405279).
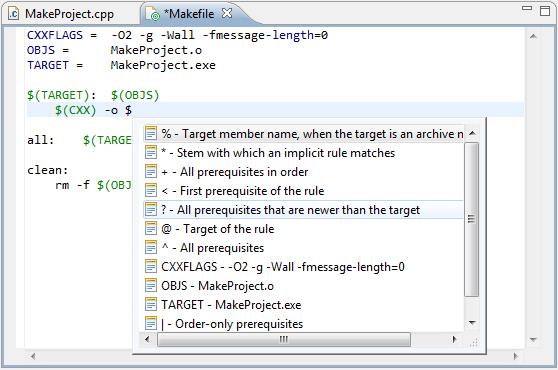
- Content assist for automatic variables (Bug 407169).
- Highlight for conditional variable assignment (Bug 406596).
- Proper colorization of escaped # (Bug 404599).
Misc
- Ability to specify local includes for indexer, as in [#include "header.h"] as opposed to system includes [#include <header.h>] (Bug 388368).
- Fixed some bugs related to storing environment variables, such as silently ignoring removals or additions (Bug 348781, Bug 355488).
- Improved performance in certain areas (Bug 405643, Bug 405638, Bug 405744, Bug 407483).
- User documentation for Scanner Discovery updated including property page "Preprocessor Includes, Macros" (Bug 409392).
Debug
Enhanced Expressions
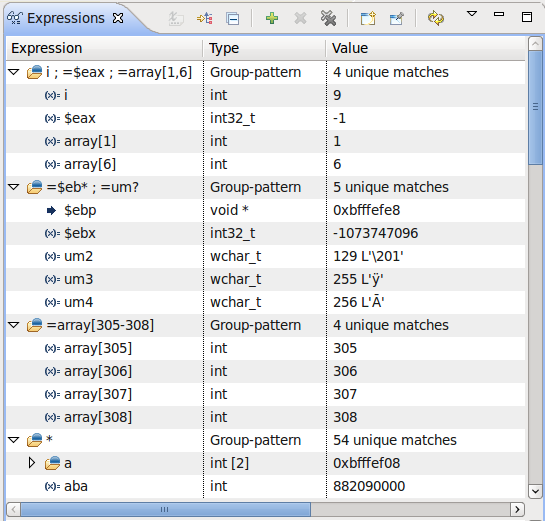
The Expressions view has been extended to allow the user to manually create enhanced-expressions. Enhanced-expressions define a set of expressions which can be easily described using glob-pattern matching. The user specifies an enhanced-expression by prefixing it with '='. For example:
- pattern-matched sorted groups of local variables, where the symbols * [] ? can be used e.g.,
=v?r     -- Will show local variables starting with a 'v' and ending with 'r' with a single character in between
=*       -- Will show all local variables of the selected stack frame in sorted order (the '=' is optional for this expression, i.e., '*')
=*x      -- Will show local variables ending with 'x'
- array ranges including glob-expressions
=array[30-40]        -- Will show array elements from 30 to 40
=array[1-5,20,30-31] -- Will show array elements from 1 to 5, 20 and 30 to 31
=array?[1-5]         -- Will show array elements from 1 to 5 for any array starting with 'array' followed by a single character
- pattern-matched sorted registers groups, where the symbols * [] ? can be used e.g.,
=$e?x     -- Will show all registers starting with 'e' and ending with 'x' with a single character in between
=$*       -- Will show all registers (the '=' is optional for this expression, i.e., '$*')
=$*x      -- Will show registers ending with 'x'
=$st[3-5] -- Will show registers $st3, $st4, $st5
- semi-colon-separated, individually sorted groups of expressions, e.g,
var1; var2 -- Will create a group containing both var1 and var2
$eax; var1 -- Will show a group containing register $eax and variable var1
var1; =$e*  -- Will show a group containing variable var1 as well as all registers starting with 'e'
This feature allows to quickly define multiple expressions that interest the user. Because groups are created from these special expressions, they can be collapsed when uninteresting and re-expanded later, without having to be re-entered by the user.
This feature was completed through Bug 381754 and Bug 394408.
Note that the comma (,) is not allowed as a group separator as it is used within valid expressions that use templates (e.g., ((((((class std::_Vector_base<int, std::allocator<int> >) v))._M_impl))._M_start)).
OS Resources View
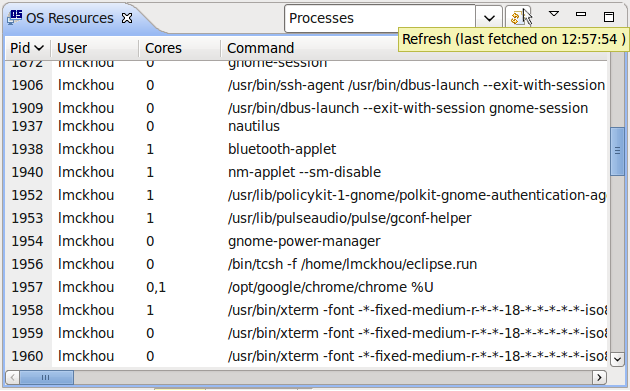
CDT has a new view called "OS Resources". This view will display different information about the resources of the operating system. For example, it can give a list of all processes running on the target. The view will display the information as provided by GDB.
As of writing, GDB supported the following information:
Processes             - Listing of all processes
Process groups        - Listing of all process groups
Threads               - Listing of all threads
File descriptors      - Listing of all file descriptors
Sockets               - Listing of all internet-domain sockets
Shared-memory regions - Listing of all shared-memory regions
Semaphores            - Listing of all semaphores
Message queues        - Listing of all message queues
Kernel modules        - Listing of all loaded kernel modules
Notes:
- For performance reasons, the view is not automatically refreshed. Press the Refresh button on the the view toolbar to fetch the latest information. Hovering over this Refresh button will display the time at which the information was last obtained.
- Columns can be re-sized.
- Columns can be removed or added using the view menu.
- Entries can be ordered by column by pressing on the column header.
- When doing debugging of a remote target, the information in the view pertains to the remote target.
This feature requires GDB 7.5 and higher. Furthermore, as of GDB 7.5, this feature only works for Linux.
This feature was completed through Bug 360314.
Breakpoint Filtering
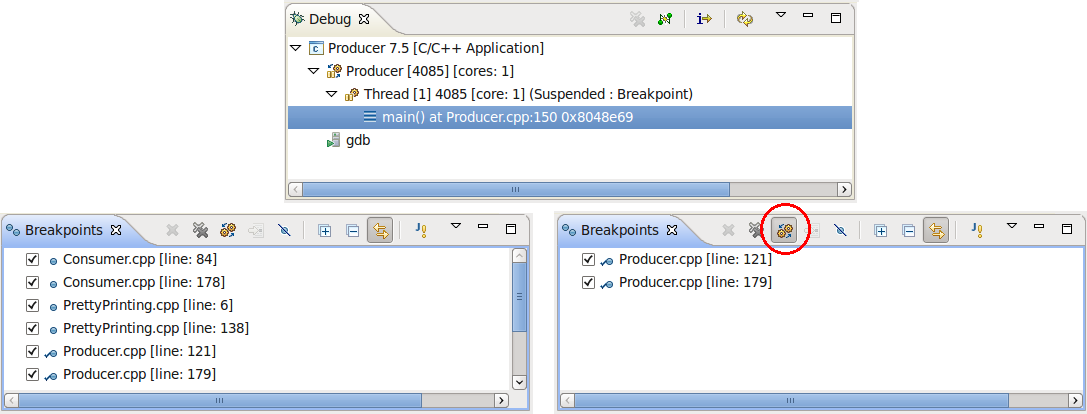
The CDT has enhanced the standard behavior of the "Show Breakpoints Supported by Selected Target" option of the Breakpoints view. Using this option with the CDT will now only show breakpoints that are actually applicable to the current debug session. Therefore, when debugging a C/C++ application, the user will not be bothered with the breakpoints set in the code of an another C/C++ application.
For backwards-compatibility, a preference is provided to revert this new behavior to the original one. The original behavior of this option is to have the Breakpoints view show all breakpoints that are of the same type as the current debug session. For example, if debugging Java, only Java breakpoints would be shown, and if debugging C/C++ only C/C++ breakpoints would be shown. This preference can be found under "C/C++ -> Debug -> GDB -> Use aggressive breakpoint filtering".
This feature was completed through Bug 360735.
Enhanced GDB console support
CDT is being improved to update its views with any change made to GDB by the user from the GDB console. Updates are being added gradually and the final goal is to allow the user to perform any command from the GDB console, and have CDT stay synchronized with the changes.
Breakpoints, watchpoints and tracepoints
Breakpoints, watchpoints or tracepoints set from the GDB console are now shown in the Breakpoints view. All breakpoint related GDB commands are supported and synchronized with the UI. No support for catchpoints yet. This feature requires GDB 7.4 or higher.
This feature was completed through Bug 392512.
Memory and variables
Memory and variables modified from the GDB console are now updated in the Memory, Memory Browser, Variables and Expressions views. This feature requires GDB 7.6 or higher.
This feature was completed through Bug 397715.
Reverse debugging state
CDT will now properly update the status of reverse debugging if its state is modified through the GDB console. This feature requires GDB 7.6 or higher.
This feature was completed through Bug 399163
Breakpoint actions to control reverse debugging
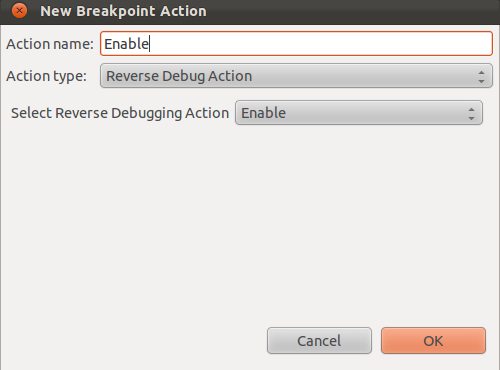
It's now possible to control the enabling, disabling and toggling of the reverse debugging mode, through breakpoint actions. The reverse debugging mode can be useful to debug, but has a significant performance cost when enabled. Using the new breakpoint action to enable the reverse debug mode, one can program a breakpoint to enable that mode in the vicinity of the suspected source code. That way, until that point is reached, no performance impacts are felt.
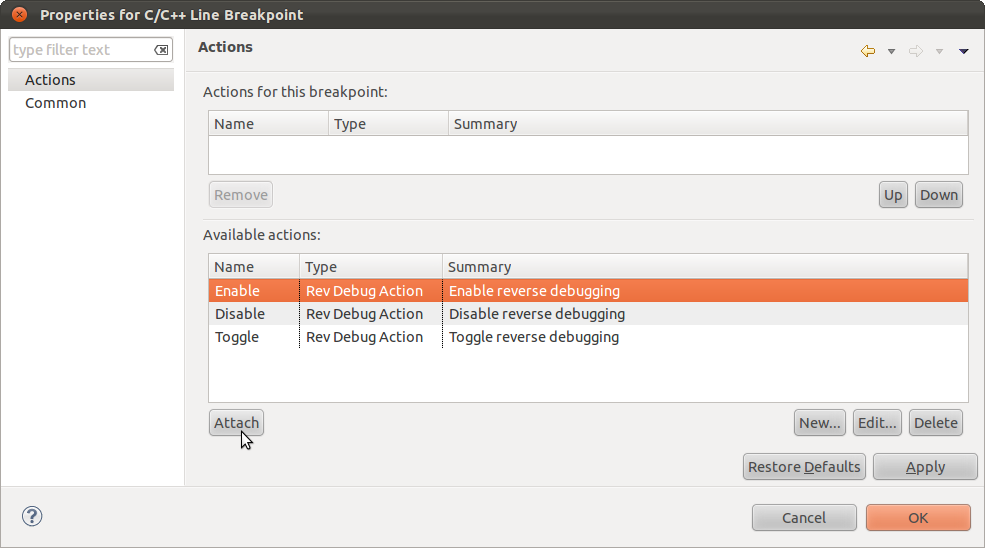
To use this feature, right-click on a breakpoint and select "Breakpoint Properties". Then in the left page, chose "Actions". Then click "New". In the new dialog, select the Action Type "Reverse Debug Action". Then chose if the action should enable, disable or toggle the reverse debug mode. Finally chose a name for the action. When done, click "Ok"
The newly created action will appear in the list of available actions, that can be attached to any breakpoint To attach it to the current breakpoint, click on "Attach".
Note: For the reverse debug breakpoint actions to work, reverse debugging must be available in the current debug session. For instance, it will not work if the "non-stop" mode is active.
This feature was completed through Bug 365776.
Floating Point renderer has been added to the memory package
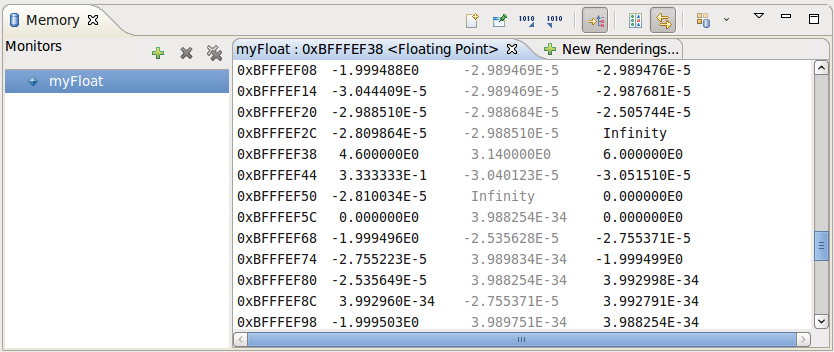
A floating point render has been added to the memory package. So now there is the Traditional renderer and a Floating Point renderer available. This render allows display and editing of the floating point values. Since it originated from the Traditional render, it's workflow and style are similar. There is no ASCII data pane display, since this did not seem to make much sense with floating point data.
This feature was completed through Bug 394509.
Debugging multiple processes within one debug session
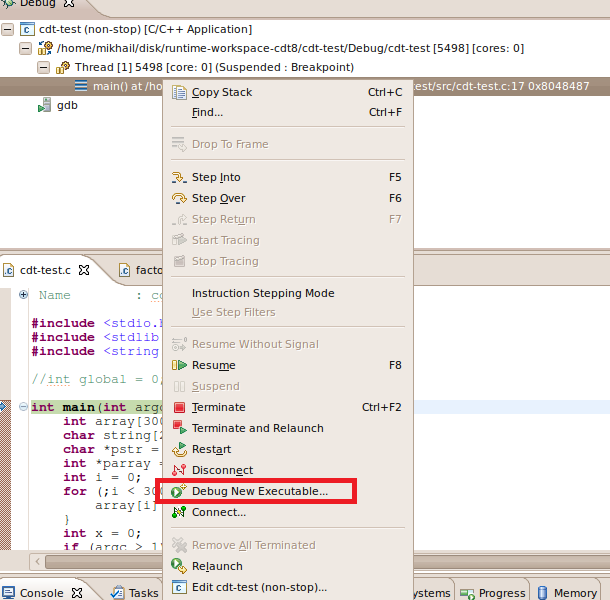
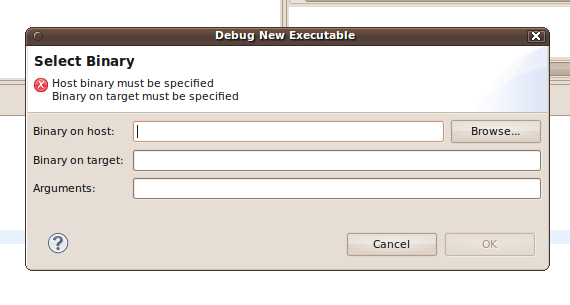
Debugging a new executable in the same debug session has been improved for GDB versions starting from 7.2. "Debug New Executable" action has been added to the context menu of the Debug view.
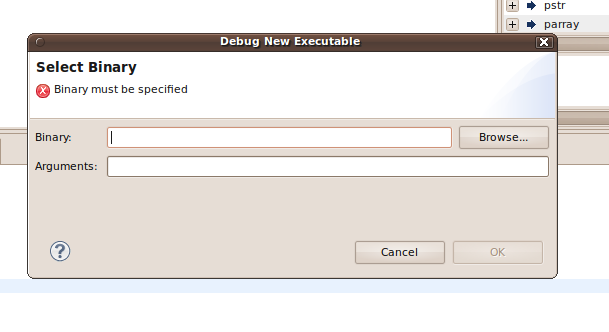
The dialog for specifying an executable to debug for local sessions has been changed.
The ability to debug a remote executable using gdbserver has been added.
This feature was completed through Bug 344890.
Load information in the Multicore Visualizer - CPU/core load meters
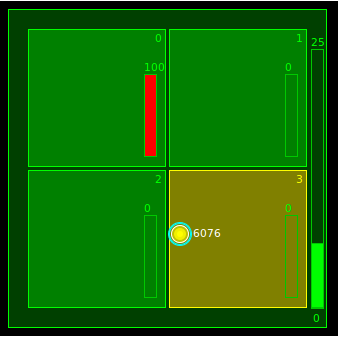
The Multicore Visualizer view has been enhanced to support system load monitoring, in the form of graphical load meters, showing the load of the system being debugged (local or remote). This works only on Linux targets for now. By default this feature is disabled, as it may cause a bit of increased load when remote-debugging. Here is what it looks-like, when enabled:
When enabled and space permits, a load meter is displayed for each core and also one for each CPU, that shows the average load for all contained cores.
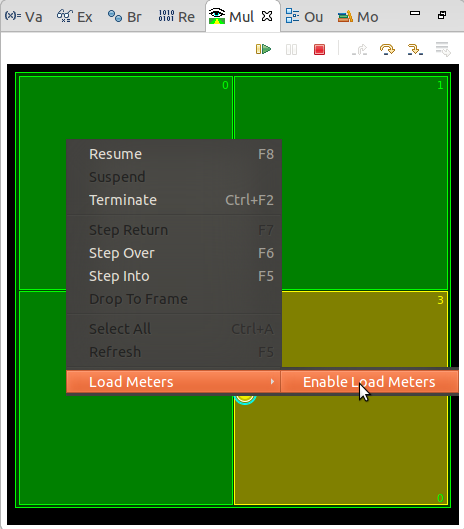
To enable the load meters, one has to use the context menu of the Multicore Visualizer; right-click on the visualizer, go into the "Load Meters" sub-menu and select "Enable Load Meters" :
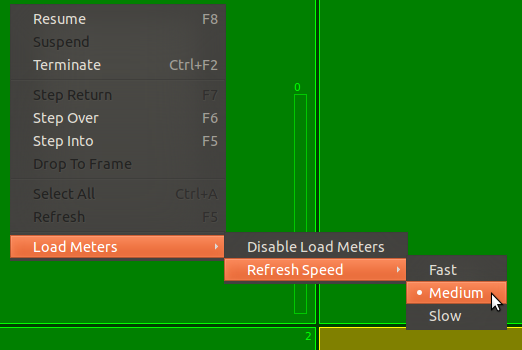
It's also possible to choose the load meters refresh interval. When the load meters are enabled, a "Refresh Speed" entry is added to the Load Meters sub-menu. There you have a choice of three refresh speeds. Selecting one makes it take effect.
This feature was completed through Bug 396268.
Edit Tracepoint on Create
It is no longer necessary to first create a CDT Tracepoint, then edit its properties. Properties such as enabled, pass count, condition, can be set while creating the tracepoint.
There are different methods to open the properties dialog before creating the Tracepoint. First, using the editor popup menu by right-clicking on the editor gutter, one must set the Breakpoint Type to "C/C++ Tracepoints".
- Add Breakpoint action.
- Select the Add Breakpoint... menu item.
- This brings up the tracepoint properties dialog for a line tracepoint pre-filled with the tracepoint's location.
- Control-Double Click
- Hold the Control key while double-clicking on the editor gutter.
- This brings up the breakpoint properties dialog for a line breakpoint pre-filled with the breakpoints location.
Step Into Selection
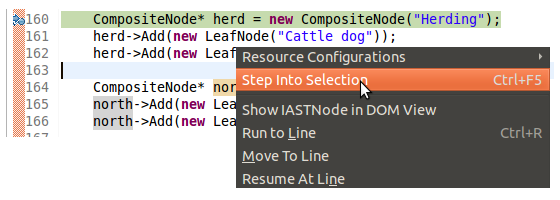
With the DSF debugger it is now possible to select a function to step into.
The selected method can be in a different line than the one under execution
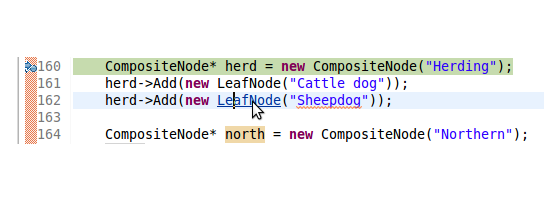
The two main methods to do this are
- Using the context menu
Select a method, right-click and select "Step Into Selection"
or use the short key Ctrl+F5
- Using the hyper link navigation
Press Ctrl-Alt, hover over a function and mouse click on it
NOTE: This first implementation runs to the selected line, steps into its methods and stops when a method is entered having the same name and number of arguments of the selected method i.e. Argument types are not validated at this point.
This feature was a contribution from Alvaro Sanchez-Leon on May 1st, 2013. For details see Bug 244865.
Multicore Visualizer enhanced selection and filtering
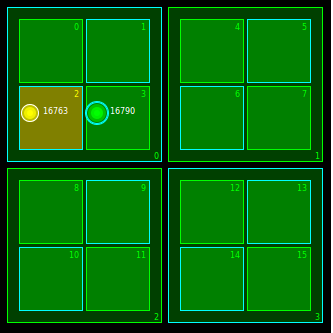
The multicore visualizer has been enhanced so that it's now possible to select CPUs and cores, in addition to threads. The previous selection methods still work (ctrl-left-click add-to-selection, left-click and drag, etc), but now are also applicable to CPU and core graphical objects.
This feature was completed through Bug 404894.
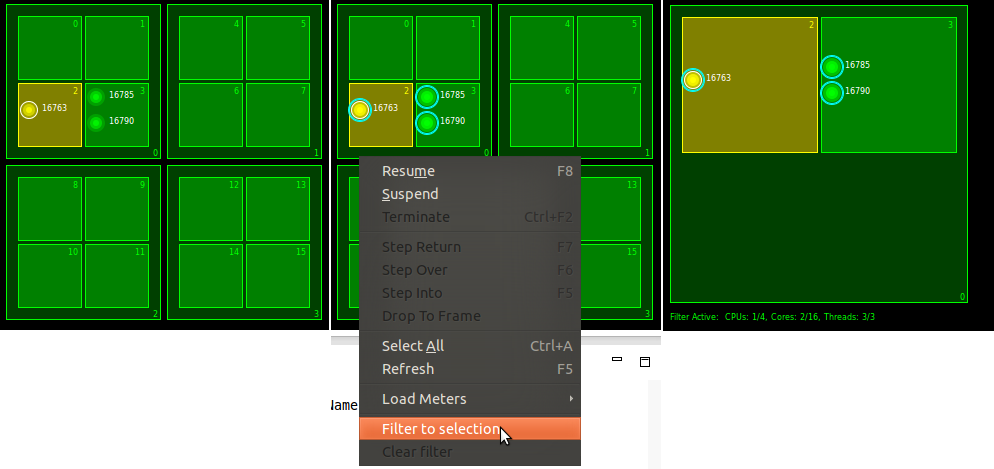
Building on the enhanced selection, it's now also possible to filter what is shown in the multicore visualizer. This is especially useful in cases where there are many CPUs/cores/threads, and one wants to concentrate on a subset. To filter the view, first select the graphical elements you want to keep, then from the context menu, chose "Filter to selection". The selected graphical elements will be shown, along with any parent objects; for instance a thread will be shown in its core and CPU. The filter stays in place until cleared, using the context menu "Clear filter".
This feature was completed through Bug 405390.
Process exit code shown in console
When a process completes execution normally, its exit code is shown in the title of that process' console. If the process is terminated or disconnected by the user, no exit code will be shown.
Note that if there is no process console, then no exit code can be displayed. This affects remote debugging and attach debugging. We hope to address this in the next release of CDT.
This feature was completed through Bug 402054.
Important Notes
Although CDT 8.2 is meant to be a backwards-compatible release, the following exceptions should be noted.
- The package org.eclipse.cdt.dsf.gdb.multicorevisualizer.internal was made API by mistake when first released. It has now been officially marked internal. Note that the package has always had the word 'internal' in its name. We don't believe there are any extenders to this package yet.
Bugs Fixed in this Release
See bugzilla report Bugs Fixed in CDT 8.2

