Notice: this Wiki will be going read only early in 2024 and edits will no longer be possible. Please see: https://gitlab.eclipse.org/eclipsefdn/helpdesk/-/wikis/Wiki-shutdown-plan for the plan.
Difference between revisions of "CDT/User/NewIn81"
| Line 91: | Line 91: | ||
[[Image:Cppcheck-config-2.png]] | [[Image:Cppcheck-config-2.png]] | ||
| − | Users can specify the path of the Cppcheck executable, the arguments to pass and whether Cppcheck’s output should be displayed in the console. | + | Users can specify the path of the Cppcheck executable, the arguments to pass and whether Cppcheck’s output should be displayed in the console. |
| + | |||
| + | A demo of this checker can be found [http://www.youtube.com/watch?feature=player_embedded&v=_OKpQ-W09MU here]. | ||
| + | |||
| + | The new infrastructure makes it very easy to write your own external-tool-based checker. In the simplest case, you will need to: | ||
| + | |||
| + | *Extend the abstract class AbstractCxxExternalToolBasedChecker. | ||
| + | *Provide the name of your tool (e.g. "Cppcheck".) | ||
| + | *Provide default values for the path of the executable, arguments to pass and whether the output of the tool should be displayed in the console. | ||
| + | *Provide one or more implementations of AbstractOutputParser. They will parse the output of the external tool, line by line. It’s up to you to decide what to do with the output (e.g. create error markers.) | ||
| + | |||
| + | In the case of tools that are complex to set up, the new infrastructure is extremely flexible and configurable. It allows you to pretty much to configure every single aspect of the checker, from the files that the tool can check to the way to feed arguments to the tool. | ||
Revision as of 20:09, 24 February 2012
Contents
Debug
Multicore Visualizer View
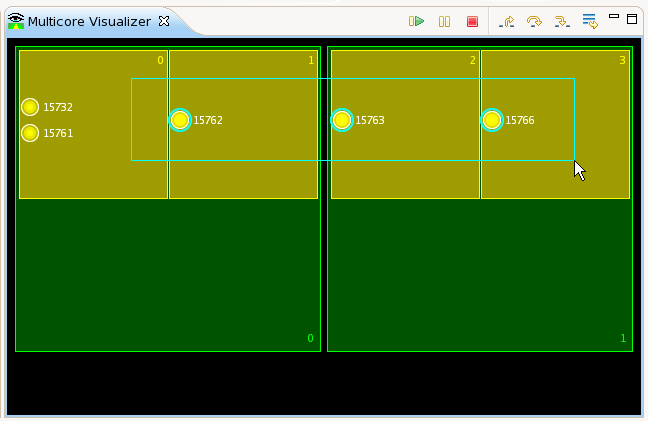
CDT now optionally includes a Multicore Visualizer View. This view displays a graphical representation of the state of the current application. It allows one to click- and drag-select groups of processes/threads, and apply debugging commands to them directly from the visualizer. Selections made in the Visualizer View are reflected automatically in the Debug View, and vice versa. The Multicore Visualizer View is designed to scale to large numbers of cpus and cores-per-cpu on both current and future multicore hardware.
The Multicore Visualizer View is meant to serve as a high-level visual overview of the current application, and can be used in tandem with the Debug View, which provides more in-depth detail.
The Multicore Visualizer View is just one example of a visualizer based on the underlying Visualizer Framework plugin. This provides a pluggable, extensible platform for developing visual development tools of this kind.
Note that the Multicore Visualizer will only work using a Linux target; it will not work debugging on a Windows or Mac target. This is a current limitation of GDB which does not provide information about cores, for those targets (at writing, GDB is at version 7.4).
This feature was completed on February 10th, 2012. For details see Bug 335027
The Multicore Visualizer is an optional feature of the CDT and must be installed manually. The feature is called "C/C++ Multicore Visualizer". Installing it will install both the Multicore Visualizer and the Visualizer Framework. If you only want to install the Visualizer Framework (to build your own visualizer), you can install that feature by itself; it is called "CDT Visualizer Framework".
Partitioning of large arrays
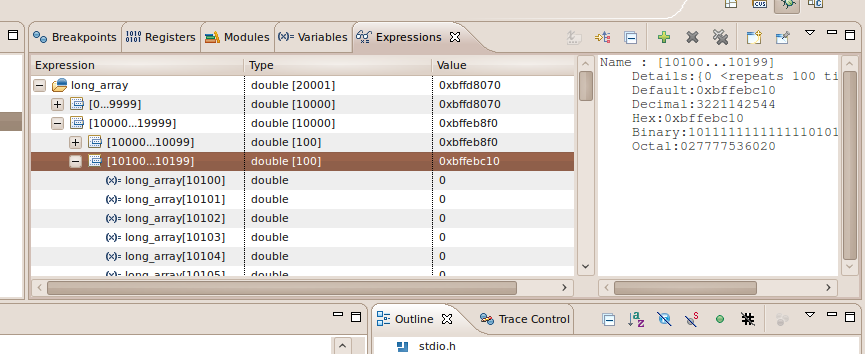
CDT now displays large arrays as collections of partitions.
This feature was completed on January 26th, 2012 as part of Bug 365541
Multi-select attach dialog
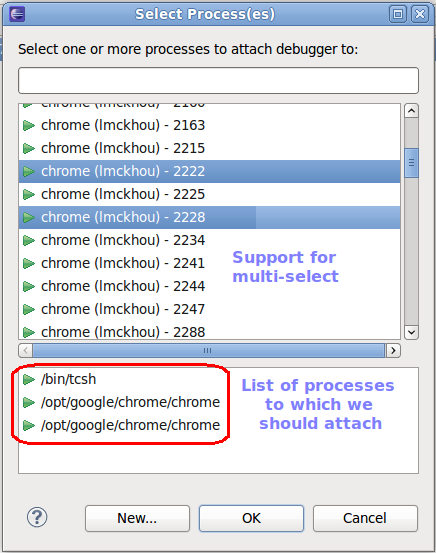
CDT now allows selecting more than one process to attach to in a single user operation. The bottom pane is used to see which processes have been selected. If multi-process debugging is not supported with your debug session (needs GDB >= 7.2 and NonStop enabled), only the first process will be attached to.
This feature was completed June 30th, 2011 as part of Bug 293679
Default Core file location for Postmortem debugging
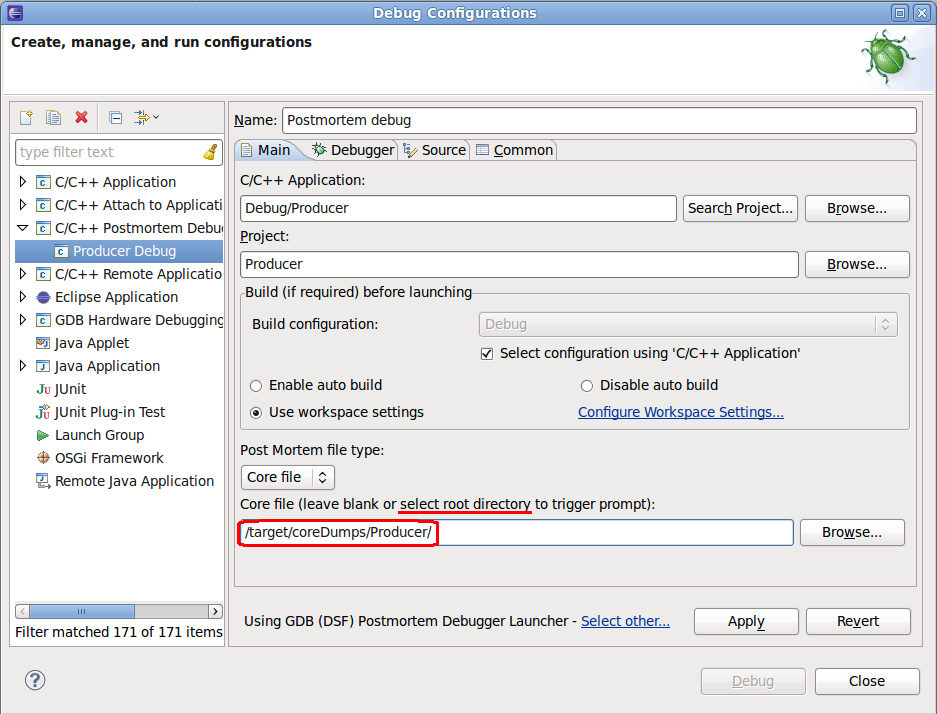
CDT now allows the user to specify a default directory for the location of core files for a postmortem launch. Since a postmortem launch can easily be re-used for different core files of the same binary, this feature helps reduce the amount of navigation needed to select a core file. Note that specifying the actual core file is still supported, as well as leaving the entire field blank, which will use the default directory.
Note that this 'core file' field supports the use of variables such as ${workspace_loc}.
This feature applies to both core files and trace files.
This feature was completed on February 17th, 2012 as part of Bug 362039
Support for Fast Tracepoints
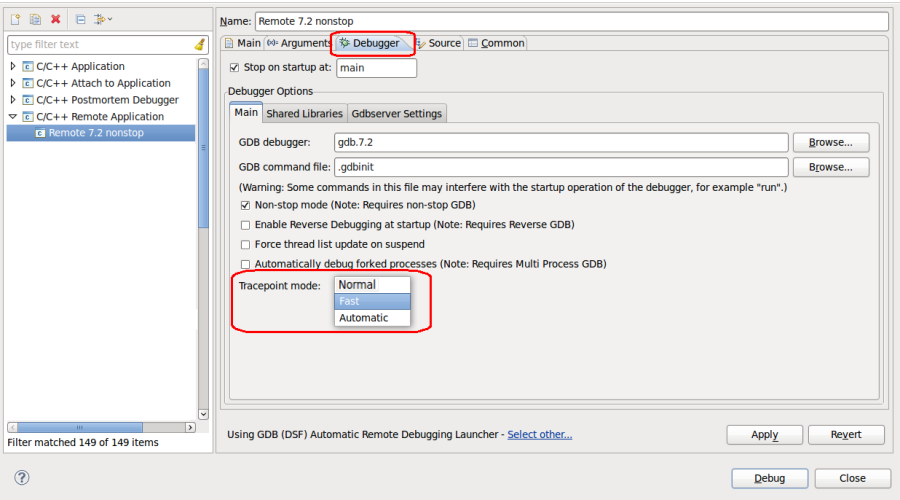
CDT now allows the user of fast tracepoints, as supported by GDB. Fast tracepoints use an instruction jump instead of a trap for efficiency. Fast tracepoint need a minimum of space to be inserted in the program and therefore, may fail to be set at certain locations. For fast tracepoints to work, a special library called the in-process agent (IPA), must be loaded in the inferior process. This library is built and distributed as an integral part of gdbserver. Please see the GDB documentation for more details.
The user can select between three tracepoint modes in the launch:
- Fast: Only use fast tracepoints. No tracepoint will be planted if a fast tracepoint cannot be used.
- Slow: Only use slow tracepoints.
- Automatic: Attempt to use fast tracepoints. If a fast tracepoint cannot be used, automatically use a slow tracepoint.
This feature was completed July 20th, 2011 as part of Bug 346320
Editor
Pin the Call Hierarchy View
The Call Hierarchy View can now be pinned which enables the user to open multiple Call Hierarchy views at the same time.
This feature was completed November 12th, 2011 as part of Bug 342498
Codan
External-tool-based Checkers
The main motivation for integrating Codan with external tools is to enjoy all the code checks from mature tools without leaving Eclipse. With the new infrastructure:
- External tools can be configured using Codan’s preference page
- External tools are invoked automatically when a C/C++ file is saved
- The output of these tools can be displayed as editor markers
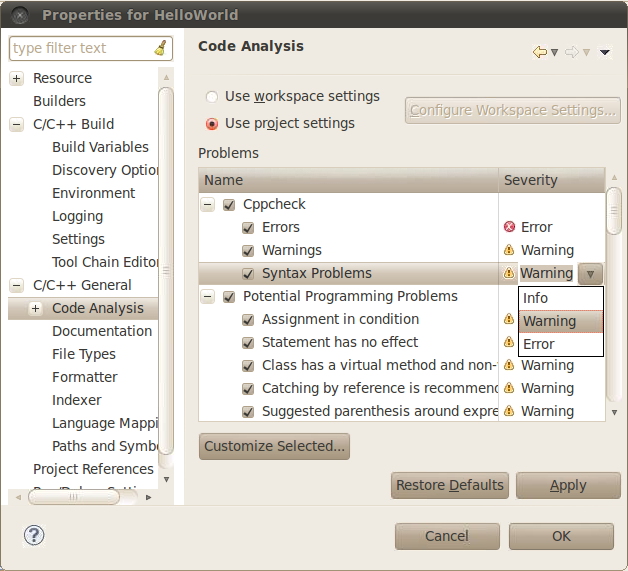
The new infrastructure includes a checker that invokes Cppcheck. This checker is disabled by default but it can be easily enabled and configured in the Codan preference page.
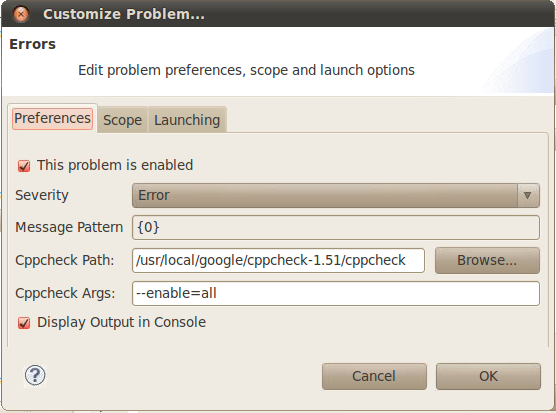
A more detailed configuration dialog can be found by pressing the “Customize Selected…” button:
Users can specify the path of the Cppcheck executable, the arguments to pass and whether Cppcheck’s output should be displayed in the console.
A demo of this checker can be found here.
The new infrastructure makes it very easy to write your own external-tool-based checker. In the simplest case, you will need to:
- Extend the abstract class AbstractCxxExternalToolBasedChecker.
- Provide the name of your tool (e.g. "Cppcheck".)
- Provide default values for the path of the executable, arguments to pass and whether the output of the tool should be displayed in the console.
- Provide one or more implementations of AbstractOutputParser. They will parse the output of the external tool, line by line. It’s up to you to decide what to do with the output (e.g. create error markers.)
In the case of tools that are complex to set up, the new infrastructure is extremely flexible and configurable. It allows you to pretty much to configure every single aspect of the checker, from the files that the tool can check to the way to feed arguments to the tool.

