Notice: this Wiki will be going read only early in 2024 and edits will no longer be possible. Please see: https://gitlab.eclipse.org/eclipsefdn/helpdesk/-/wikis/Wiki-shutdown-plan for the plan.
CDT/Archive/designs/Tracepoints
Contents
Current Status
The current status of this effort can be also seen in the Tracepoint Bug (284286)
Tracepoints are now supported in CDT. Not all features are functional yet. An more recent HOW TO can be accessed here
Introduction
This page describes the proposed design for support of Tracepoints in the CDT. The design is divided into multiple phases. The first phase is restricted to the control of tracepoints, which includes creation, deletion and configuration. Further phases will address the actual collection and visualization of tracing data. This multi-phase approach aims as making the review process easier.
The proposed solution attempts to make tracepoint-support generic to allow for the easy integrations of different backends. However, an actual implementation using GDB Tracepoints will also be contributed but only for the existing DSF-GDB integration.
Definitions
This page is based on the below characteristics of tracepoints. The tracepoint concept is extremely similar to the breakpoint concept. Like breakpoints, tracepoints have the following characteristics:
- can be created and deleted based on a line of code or address or function
- can be enabled or disabled
- can have an associated condition
- can have an associated ignore-count (not supported by GDB)
- can be associated to a specific set of threads (not supported by GDB)
- can have an associated list of commands (in GDB those commands are limited to 'eval', 'while-stepping' and 'collect')
- can be imported/exported from/to a file
Some of the characteristics specific to tracepoints are:
- can have an associated passcount which, when reached, will turn off the data collection
- can use trace-state variables (see Trace-state Variables section) (could be considered GDB-specific)
- can have a set of global commands which are attached to all tracepoints (could be considered GDB-specific)
- can remain defined on a target even if the backend is no longer connected to the target. This implies then when connecting to a target, tracepoints may already exist on that target.
- has an extra state, 'active', which indicates that the tracepoint is part of on-going tracing.
Trace-state Variables
Trace-state variables are variables defined in the backend that are dedicated to tracing. These variables can be examined and modified within tracepoint conditions and tracepoint commands.
First Phase
The first phase of the design deal with how we propose to:
- create/delete tracepoints
- enable/disable tracepoints
- add conditions to tracepoints
- add an ignore-count to a tracepoint
- add a passcount to a tracepoint
Second Phase
The second phase of development will focus on the following items:
- tracepoint actions
- global tracepoint actions
- performing tracing (start, stop, status, etc)
- use of trace-state variables
Third Phase
The last phase of development will deal with more advanced concepts such as:
- active tracepoints
- visualizing trace data
- Disconnected tracing
- import/export tracepoints from file
- fast versus slow tracepoints
- observer mode
First Phase Details
Tracing Action Set
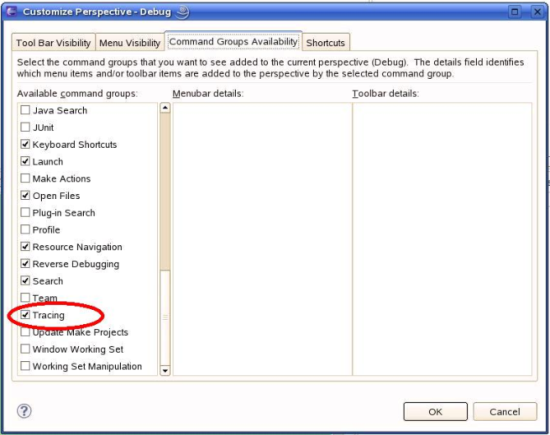
First, a new Action Set will be created to include all tracepoint-related actions and allow a user to hide them. By default this Action Set will not be visible.
Tracepoint as a type of breakpoint
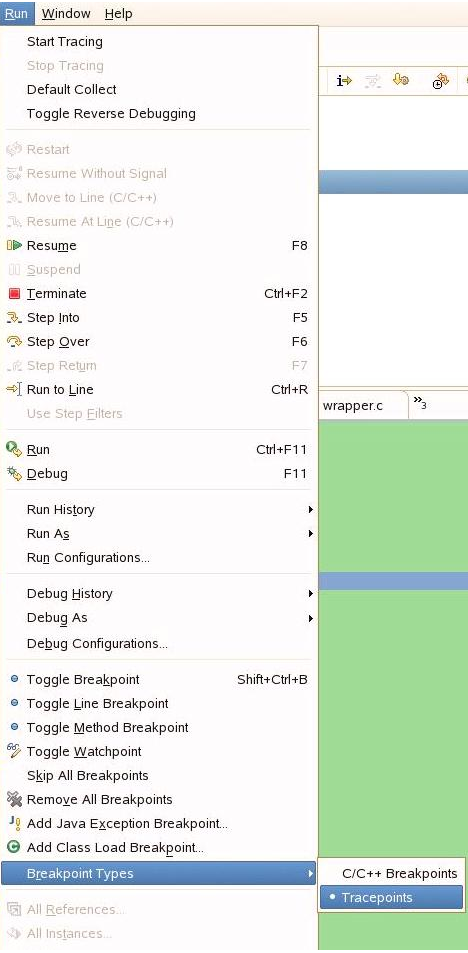
Since tracepoints are so similar to breakpoints, we propose to treat Tracepoints as a new type of breakpoint, as supported by the IToggleBreakpointsTarget interface. This approach will allow to re-use the existing breakpoint UI to handle Tracepoints. This means that breakpoint menus will be used by tracepoints, and that tracepoints will be included in the Breakpoints View. The user will simply need to select which type of 'breakpoint' is currently to be used. The UI for this selection is already part of the platform:
Note that Tracepoints will not be activated when the feature is not supported. Therefore, for CDI-GDB, this breakpoint-type selection will not be visible. It will also not be shown for DSF-GDB when running with a version of GDB that does not support the proper tracepoint functionality.
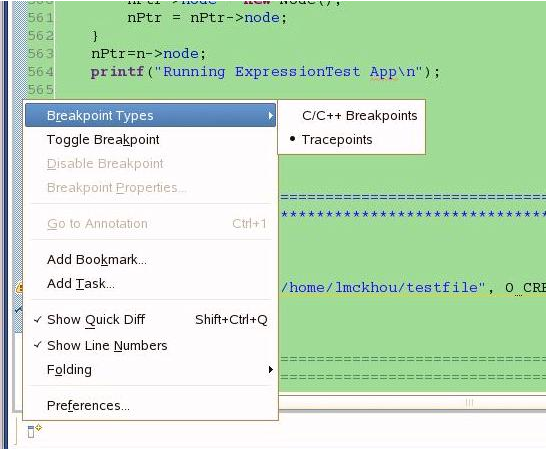
We also propose to add this breakpoint type menu to the editor margin. This is also provided by the platform, but not visible by default. We will make it visible in the CEditor:
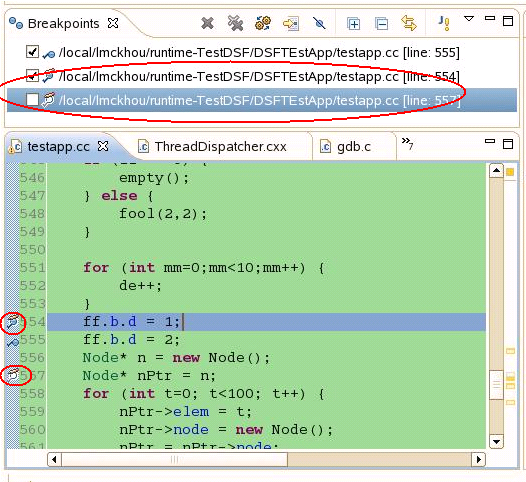
Once the type Tracepoints is selected, the Toggle Breakpoint action, as well as double-clicking on the editor margin will now create or delete a Tracepoint instead of a breakpoint. A new Tracepoint icon will be used as was suggested in the discussion as part of bug 284286 (notice the little pencil above the icon):
Enable/Disable of a tracepoint will also automatically use the same UI menus as breakpoints.
The Skip All Breakpoints action of the Breakpoints View will not be applied to tracepoints as it does not provide any added value. This is because the same functionality can be achieved by stopping tracing.
Tracepoint properties
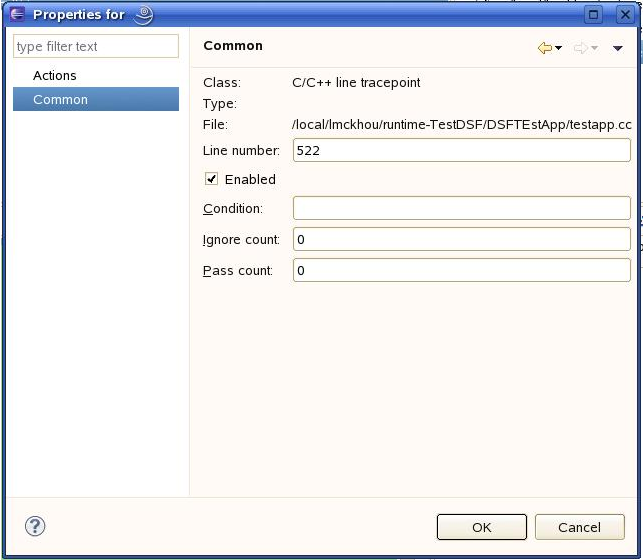
When selecting the Breakpoint Properties... action while Tracepoints are the active breakpoint type, a pop-up very similar as the one for breakpoints will be used:
Notice the absence of the Filter page on the left. The Filter page is used to associate a breakpoint to a set of threads. Although this is a valid concept for tracepoints, it is not part of this implementation. However, it could easily be added later.
As for the Actions page, it will be part of this implementation, but is not part of this document, as it requires more discussions.
Also notice the new Pass count entry, which is specific for Tracepoints. When the Pass count is reached for a tracepoint, all tracing will automatically stop.
Tracepoint and the Disassembly View
The DSF Disassembly view will also support the control of tracepoints through its existing breakpoint menus. No UI additions are planned at this time, although we may consider adding the new Breakpoint Types menu to the DSF Disassembly margin. The standard Disassembly view will not be affected by these changes as it is not used by DSF-GDB.
Breakpoint and Tracepoint at the same location
For simplicity, the first approach at dealing with a breakpoint and tracepoint in the same location is not to allow it. If a user wants to toggle a tracepoint where there is a breakpoint, it will remove the breakpoint and vice versa. This could be improved later on.
Second Phase Details
Tracepoint Actions
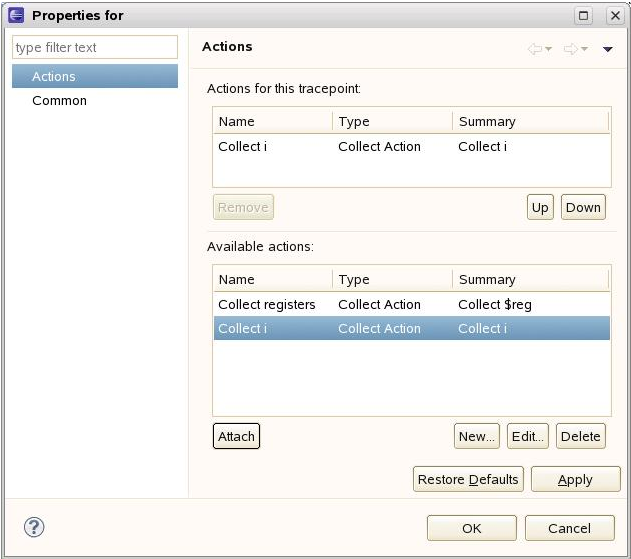
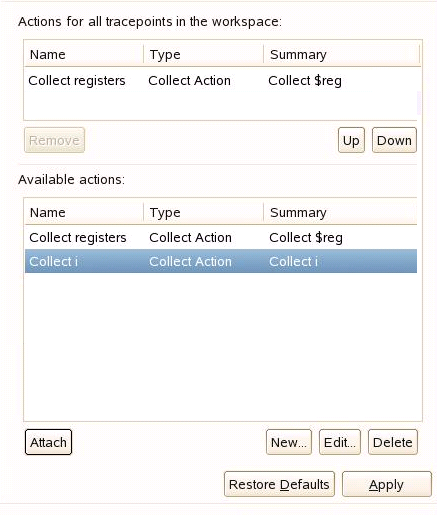
Adding actions to tracepoints will be handled in the exact same way as for breakpoints. Through the Breakpoint Properties menu of a Tracepoint, an Actions page will be available. This page will be identical to the one used for Breakpoints, as seen in the picture below.
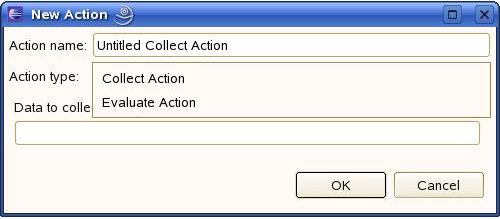
Tracepoint actions can be create, edited and deleted. Those actions can then be Attached to or Removed from a particular tracepoint. Attached actions can be ordered using the Up and Down buttons. The creation of an available action will be done similarly to breakpoints, as shown below:
The difference to note is that the list of actions available ('Action type:') is different from the ones for breakpoints. The current breakpoint actions provided in the CDT are: Sound, Log, Resume, External Tool; these actions do not really make sense for tracepoints. Therefore, those will not be made available for Tracepoints.
Instead, there will be three Tracepoint actions: Collect, Evaluate and While-Stepping. The Collect action will trigger the collection of trace data; the Evaluate action will trigger the evaluation of trace state variable expressions, without collecting any trace data; the While-Stepping action will allow to request that data be collected during a series of single steps to be executed after a tracepoint is hit. Those three actions will not be available for breakpoints, as they are tailored for tracepoints.
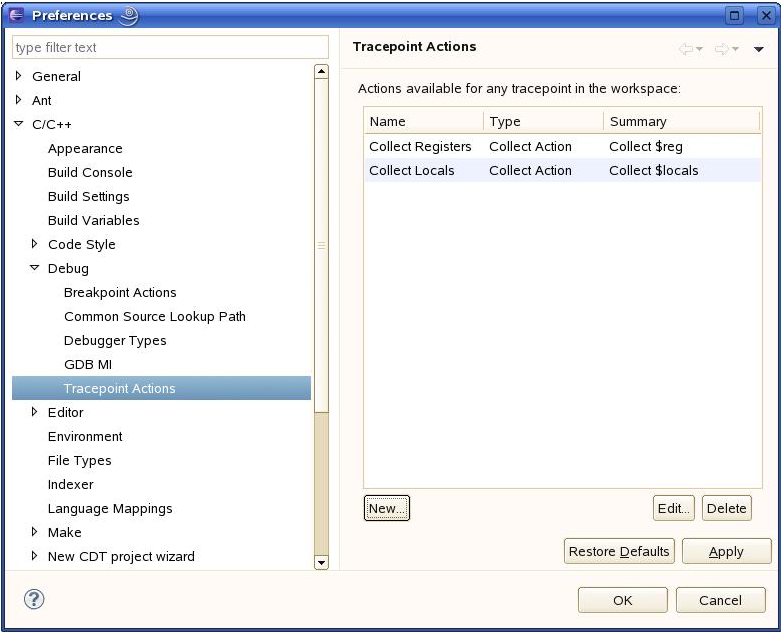
Furthermore, like for breakpoint actions, a new Preferences page will be available for Tracepoint actions as shown below:
- Note
The CDT's existing breakpoint-action support is currently being migrated to the Platform. The solution for Tracepoints will use the new platform framework if it is available in time for the next Eclipse release. If that change is not available in time, we will have to use the current CDT breakpoint-action support. Some of the detailed design proposed above may change, depending on the support provided by the Platform.
Global Tracepoint Actions
There will be support for Tracepoint Actions that are global to all tracepoints. When a user adds a global tracepoint action, that action will automatically be added to the beginning of the action list of each tracepoint. Global tracepoint actions will be created/deleted using a special command "Global Tracepoint Actions" which will open a popup as below.
Tracing Control View
Displaying the current status of the tracing experiment will be available through a new Tracing Control view. The status of the view will display information made available by the backend. The content of the view will be specific to the debugger integration. For GDB, we will display such things as:
- Is tracing started or stopped
- If tracing is stopped, what caused the stop (user or passcount)
- How many trace records have been collected
- The remaining and total size of the trace buffer
- If we are currently visualizing a trace record
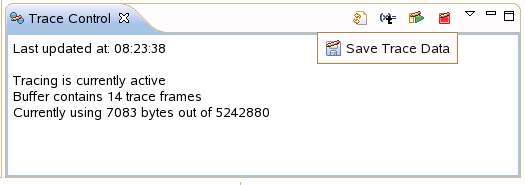
This tracing control view will also be used to control all tracing actions, through view toolbar buttons. The actions that will be supported are:
- Refresh status: Tracing is an intensive activity and therefore, we cannot update the tracing status in real-time. The refreshing of the status will be triggered by the user by using the Refresh button. Some information may be updated in real-time, such as if tracing is started or stopped.
- Start tracing
- Stop tracing
- Save trace data
- Manage trace state variables
- Navigate Trace Data
Trace Variables
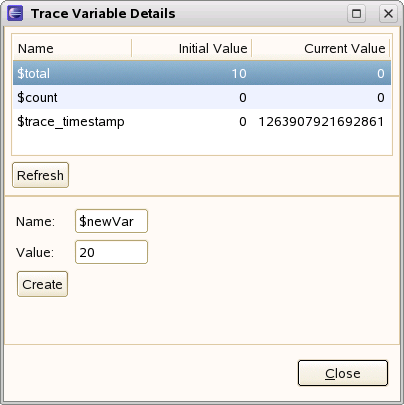
Trace Variables are variables defined in the backend which can be read and written to by tracepoints. Trace Variables can be created by the user and listed during tracing. Managing those Trace Variables will be done by pressing the Trace Variables Details button in the Trace Control view; doing this will popup a window that will list existing Trace Variables and allow the user to create new ones.
Visualizing Trace Data
Using the debug views
The debug views will be used to display available trace data of a specific point in time. For instance, when a new trace record is selected by the user, the variables view will be updated with whatever variable data is available; the registers view, the expression view and the memory view will also be used in that fashion. This approach allows the user to examine the data of interest while navigating through the trace records.
If certain information is not available in the current tracepoint data, the views will show the missing data as an error, as is done for a debugging session. Care must be taken that such missing data does not seem to be a legitimate error, but simply information that was not collected.
Offline examination of trace data
It will be possible to load trace data from a file and to view that data in the same way as when Eclipse is currently connected to a debugger. This is analogous to a Post Mortem debugging session.

