Notice: this Wiki will be going read only early in 2024 and edits will no longer be possible. Please see: https://gitlab.eclipse.org/eclipsefdn/helpdesk/-/wikis/Wiki-shutdown-plan for the plan.
BaSyx / Examples / Monitoring
Contents
Monitoring
Monitoring Applications in context of Basys Project are (open-source) third-party applications which support Basys users in the tasks of processing, monitoring, and visualizing data in real-time.
Overview
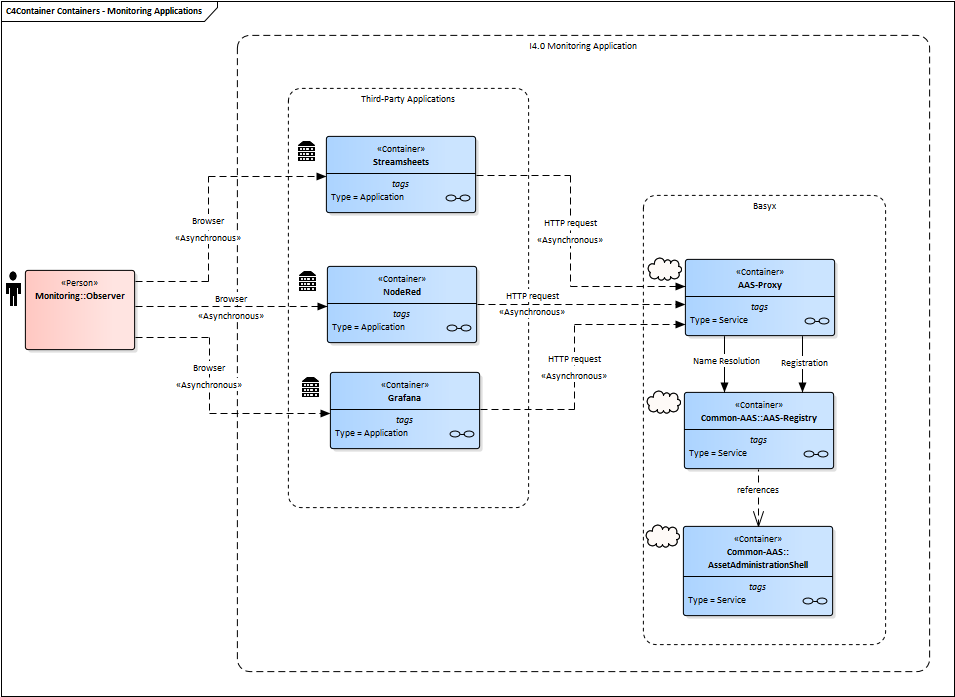
Figure 1 illustrates the interface between ASS, Registry, Proxy and Grafana/Streamsheets/NodeRed-applications.
- Registry is responsible to locate and identify available AAS(s) in the network.
- Proxy is responsible to intermediate the communication and exchange data between AAS and third-party applications.
- AAS is responsible to provide the data.
For such scenario, we assume that the AAS sub-models provide the access of multiple sensor data, which change dynamically at runtime to reflect the current production status.
How to Use
TODO: deploy the built docker images to DockerHub TODO: Push the files to BaSyx SDK
A full example for monitoring properties in Asset Administration Shells is given in the Git repository. To run this example, there exist following minimum requirements:
- Git
- A running Docker environment
To download the necessary files, you can check out the BaSyx repository from the command line with:
git clone https://git.eclipse.org/r/basyx/basyx
After checking out the repository, you can easily run the example:
1. Browse to /examples/monitoring
2. Run the "start.bat"-file or alternatively run "docker-compose up" in the /docker folder
If there are issues with the docker environment, make sure that the files inside of the git repository are shared with the docker containers by configuring the file sharing mechanism in the docker daemon settings.
How to Build
In addition to directly using the already provided docker images, it is also possible to build them by yourself using the BaSyx SDK and the supplementary projects in the GIT repository. For building the Java projects you will also need the Java Development Kit.
Requirements:
- Docker is installed and running. It has to be ensured that the docker daemon is exposed on tcp://localhost:2375 without TLS so that the docker image can be built during the build process.
- BaSyx SDK has been installed - see: https://wiki.eclipse.org/BaSyx_/_Download_/_Java_Setup
- BaSyx components (basyx.components.simple) have been installed - see: https://wiki.eclipse.org/BaSyx_/_Documentation_/_Components_/_Docker
Installation:
1. Clone BaSyx monitoring examples from the GIT repository - see: TO DO)
2. Run the install.bat
Now the automatic build process will build the project binaries and docker images necessary to run the example in accordance to the previous section.
1. Run start.bat
Automatically starts all docker containers for this example (by default in the following ports):
1. The AAS - http://localhost:6400/aas/
2. The Proxy - http://localhost:6500/proxyAAS/aas
3. The Registry - http://localhost:4000/registry/api/v1/registry/
4. Streamsheets - http://localhost:8081/
5. Grafana - http://localhost:3000/
6. Node-RED - http://localhost:1880/
Applications
Streamsheets
Streamsheets is an Eclipse project providing an application for monitoring and visualizing streams of data from various sources. With Streamsheets it is possible to process, aggregate, visualize and transform data streams in real-time as a server app. Streamsheets exchange data over REST-based protocols (request/response), and also shares messages over publish/subscribe streaming protocols like MQTT, Apache Kafka or AMQP. Streamsheets can also be customized its visual interface, buy adding images, colors, buttons.
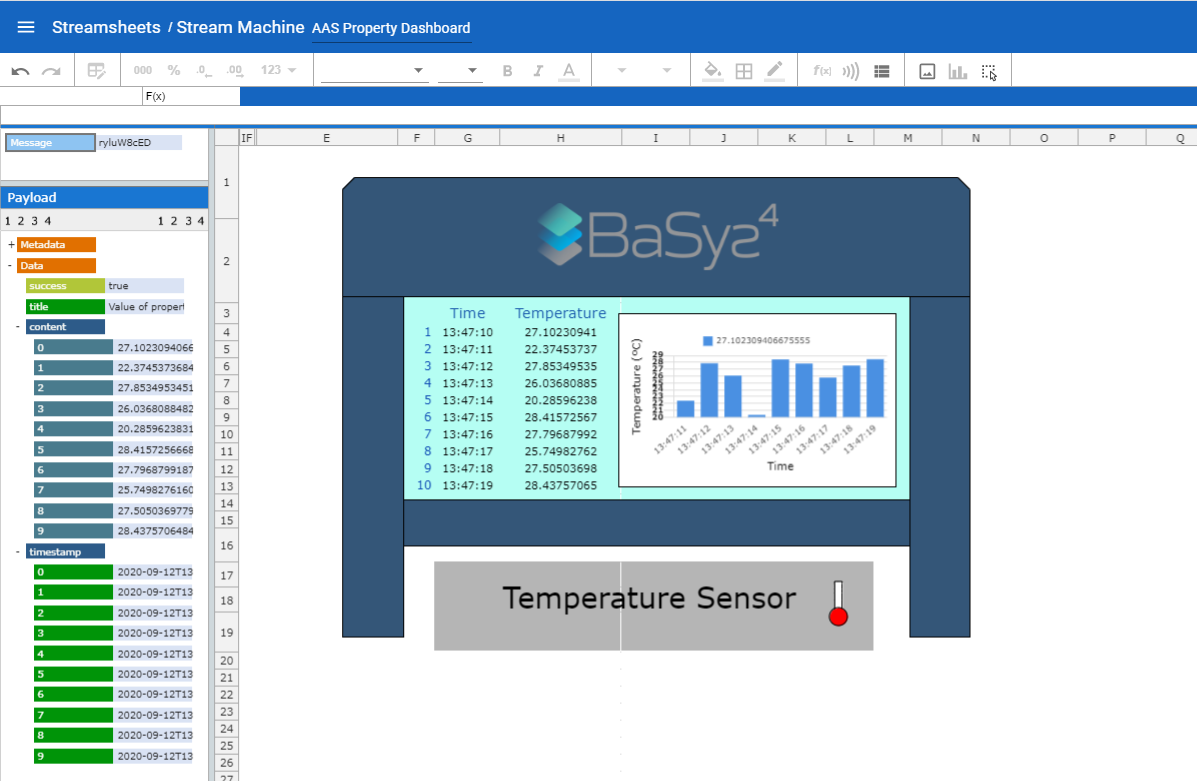
Stream Machine Example
Setting Up a New Streamsheet
The configuration of the HTTP-connector and the producer follows the following steps:
- Start by creating the Connector in the Connector Dashboard in the Administration Menu. Go to the side pane and select the “Administration”.
- In the side pane of the “Administration”, select “Streams” -> “Connectors”.
- Select the “+”-symbol on the top right to add a new connector.
- Enter a name for the connector. The others can be left empty (Figure 2). You can leave all fields empty to be able to utilize this Connector for any URL. If you want to create specific Connectors for every webpage, type in the Base URL.
- Go to Side-Pane -> “Streams” -> “Producers”. Click on the “+”-symbol on the top right to add a new producer. (Figure 3)
At run time, the data-points of the Streamsheets-application create HTTP-Requests with the producer periodically. The HTTP-connector communicates with the AAS based on these HTTP-requests. The responses are transmitted back to the Streamsheets-application. For the real time display, HTTP-GET requests are generated cyclically and the responses are updated to the data points in the Streamsheets-application. The configuration of the data points in the Streamsheets-application follow the following steps:
Grafana
Grafana is an Open-Source application for creating dashboards for different types of datasources. There is already a variety of different panels and datasources available at their official repository.
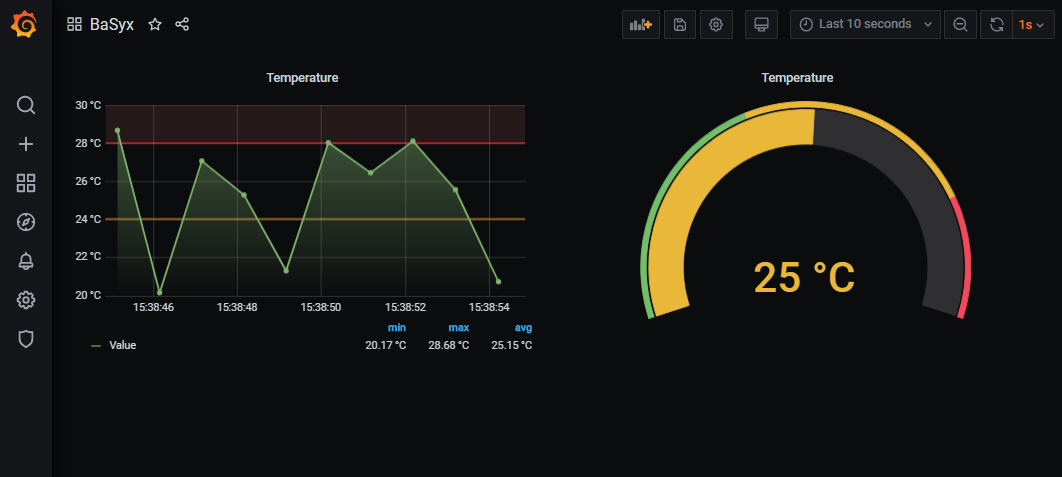
Grafana Dashboard Example
Setting up a new panel
There are two possibilities for panels that can make use of the proxy
- Use datasource plugin that comes with the example
- Use Ajax plugin => can already query any kind of JSON datasource


