Notice: This Wiki is now read only and edits are no longer possible. Please see: https://gitlab.eclipse.org/eclipsefdn/helpdesk/-/wikis/Wiki-shutdown-plan for the plan.
Difference between revisions of "CDT/User/NewIn86"
(→Debug) |
(→Pinning of Multicore Visualizer view) |
||
| Line 9: | Line 9: | ||
=== Pinning of Multicore Visualizer view === | === Pinning of Multicore Visualizer view === | ||
| − | CDT now supports the pinning of Multicore Visualizer views. A "pin view to debug session" toggle button was added to the Multicore Visualizer, that permits pinning a MV to the current debug session. | + | CDT now supports the pinning of Multicore Visualizer views. A "pin view to debug session" toggle button was added to the Multicore Visualizer toolbar, that permits pinning a MV view to the current debug session. |
| − | A Multicore Visualizer, when pinned, will continue showing the debug session it's pinned-on, even | + | A Multicore Visualizer view, when pinned, will continue showing the debug session it's pinned-on, even when another debug session is selected in the Debug view. |
| − | Here we have a workbench with | + | Pinning is most useful when used in conjunction with MV view cloning. It can be used to setup a workspace where a user can visualize what's happening with multiple debug sessions, being run in parallel. |
| + | |||
| + | Here's a simple example to demonstrate pinning: we have a workbench with two Multicore Visualizers views. There are two ongoing debug sessions in the Debug view; session #2 is selected, and shown in both MVs. Note that the new "pin" button is highlighted in the first MV: | ||
[[Image:mv-pinning-1-highlight.png]] | [[Image:mv-pinning-1-highlight.png]] | ||
| − | We switch to session 1, and both MVs follow: | + | We switch to session #1, and both MVs follow: |
[[Image:mv-pinning-2.png]] | [[Image:mv-pinning-2.png]] | ||
| − | We pin the first MV to session 1 | + | We pin the first MV to session #1 |
[[Image:mv-pinning-3.png]] | [[Image:mv-pinning-3.png]] | ||
| − | We switch to debug session 2; pinned MV stays on session 1 | + | We switch to debug session #2; pinned MV stays on session #1 |
[[Image:mv-pinning-4.png]] | [[Image:mv-pinning-4.png]] | ||
Revision as of 09:01, 27 August 2014
Contents
Build
Indexing
Refactoring
Debug
Pinning of Multicore Visualizer view
CDT now supports the pinning of Multicore Visualizer views. A "pin view to debug session" toggle button was added to the Multicore Visualizer toolbar, that permits pinning a MV view to the current debug session.
A Multicore Visualizer view, when pinned, will continue showing the debug session it's pinned-on, even when another debug session is selected in the Debug view.
Pinning is most useful when used in conjunction with MV view cloning. It can be used to setup a workspace where a user can visualize what's happening with multiple debug sessions, being run in parallel.
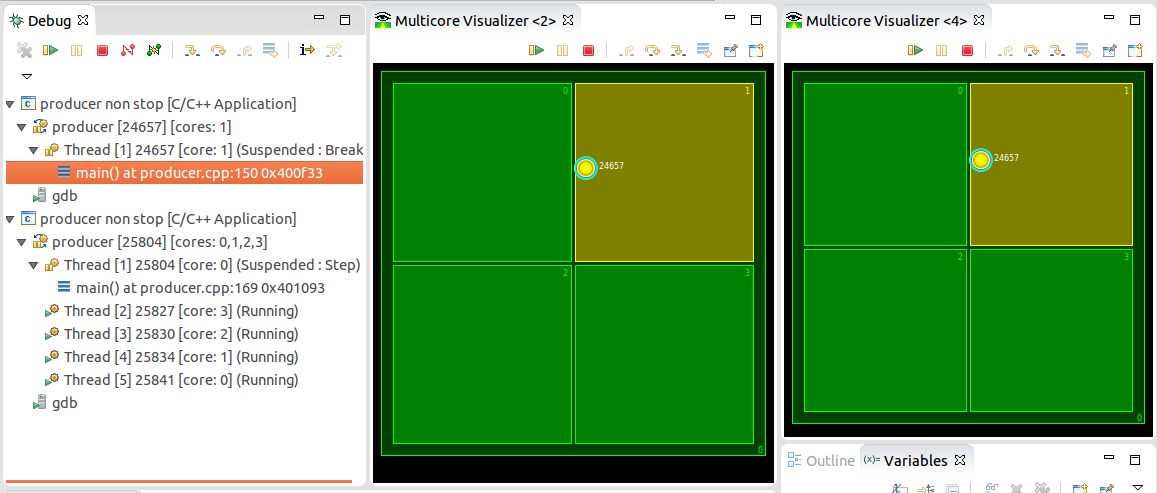
Here's a simple example to demonstrate pinning: we have a workbench with two Multicore Visualizers views. There are two ongoing debug sessions in the Debug view; session #2 is selected, and shown in both MVs. Note that the new "pin" button is highlighted in the first MV:
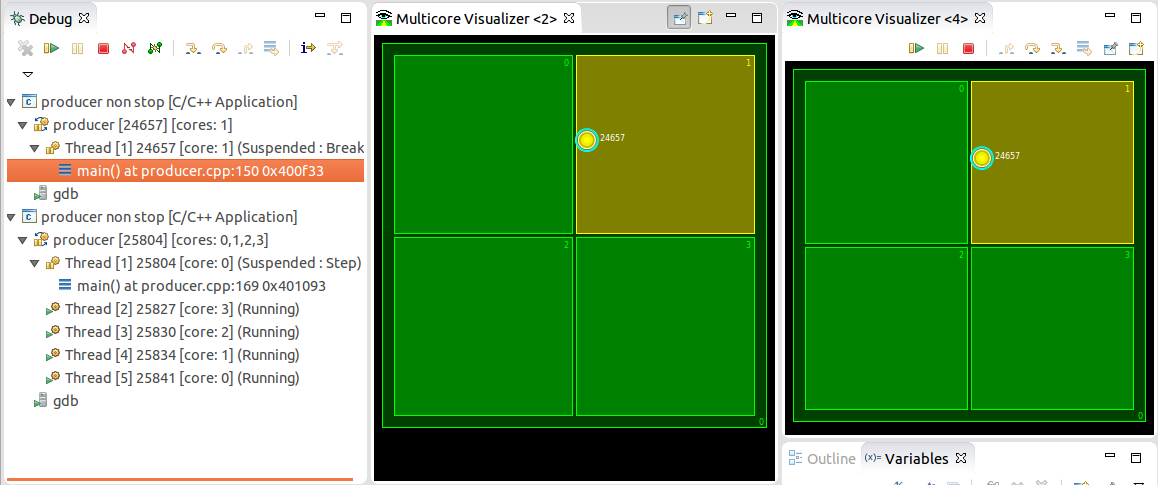
We switch to session #1, and both MVs follow:

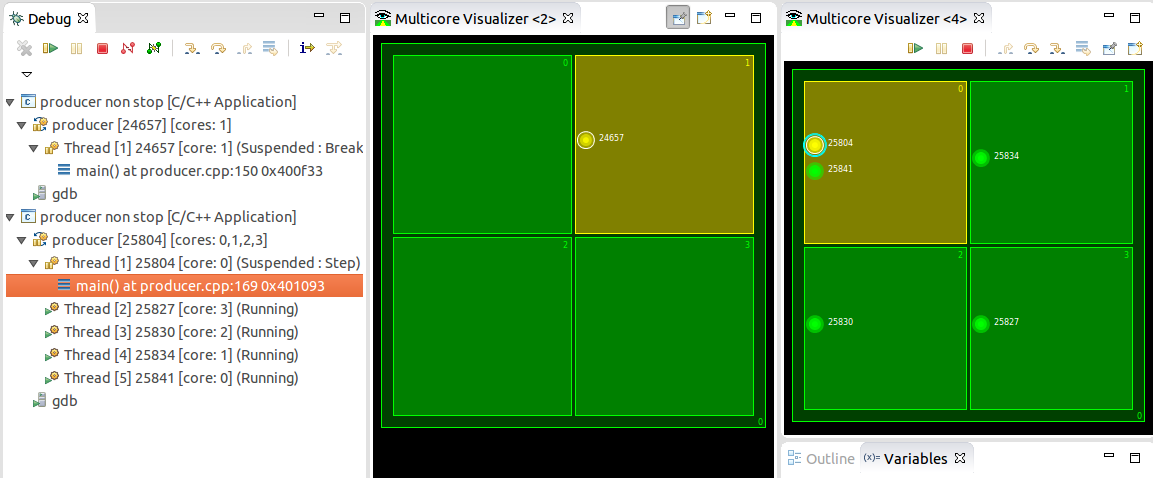
We pin the first MV to session #1

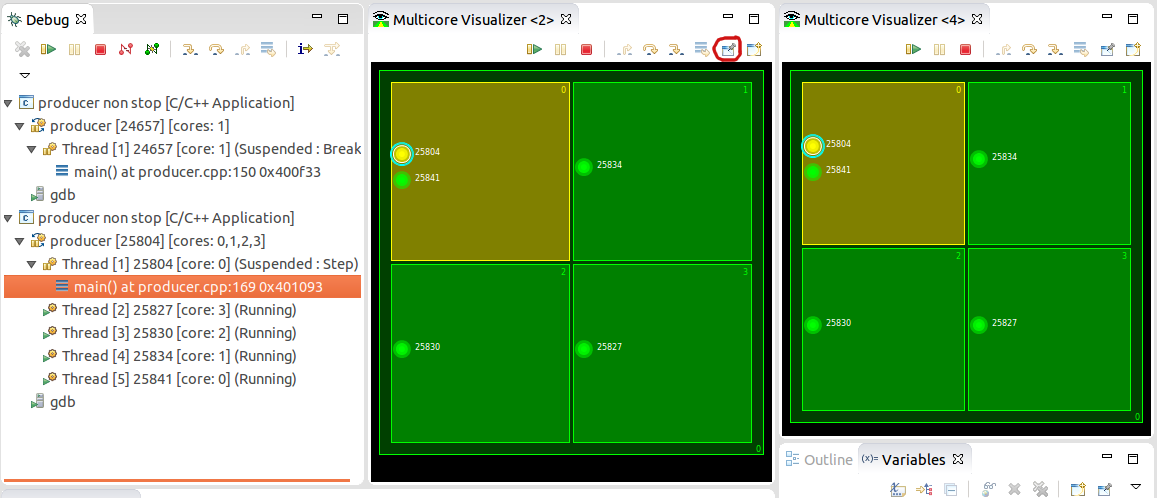
We switch to debug session #2; pinned MV stays on session #1

This feature was completed August 22nd, 2014 through Bug 441713.
General
Bugs Fixed in this Release
See Bugzilla report Bugs Fixed in CDT 8.6

