Notice: This Wiki is now read only and edits are no longer possible. Please see: https://gitlab.eclipse.org/eclipsefdn/helpdesk/-/wikis/Wiki-shutdown-plan for the plan.
CDT/Obsolete/MultiCoreDebugWorkingGroup/calls/minutes/2011
Contents
- 1 2011 Multicore Debug Workgroup Minutes of Meetings
- 1.1 December 13th, 2011
- 1.2 November 8th, 2011
- 1.3 October 25th, 2011
- 1.4 September 27th, 2011
- 1.5 August 30th, 2011
- 1.6 July 26th, 2011
- 1.7 June 21st, 2011
- 1.8 May 24th, 2011
- 1.9 April 26th, 2011
- 1.10 April 12th, 2011
- 1.11 March 23rd, 2011 - EclipseCon Workshop
- 1.12 March 8th, 2011
- 1.13 February 22, 2011
- 1.14 February 8, 2011
- 1.15 January 25, 2011
2011 Multicore Debug Workgroup Minutes of Meetings
December 13th, 2011
Attendees
- Phil Mason (Broadcom)
- Mikhail Khodjaiants (Mentor)
- Abeer Bagul (Tensilica)
- Shaiju Nair (Tensilica)
- Patrick Chuong (TI)
- Bill Swanson (Tilera)
- Pawel Piech (Windriver)
- Marc Khouzam (Ericsson)
Minutes
General
- Next call delayed one week due to holidays and since CDT monthly call will be delayed as well. Will be 17th of January
Visualizer view progress
- Bug 335027
- Talk accepted at EclipseCon Seeing is Understanding: Debugging with Multicore Visualizer
- Marc just pushed changes to support dynamic updating of multicore visualizer for thread creation and exit
- Marc to look at allowing the multicore visualizer to display when the launch or gdb node are selected
- Bill to work on visualizer selection and synchronization with Debug View.
- DebugContextProvider can be used for any view to provide the debug context. This is important if someone uses the visualizer without the Debug view. The problem is that there is no API to drive the selection in the Debug View. There are two current options:
- Faking deltas like currently done in Tilera's Grid view. Pawel recommends this one, although it is still clumsy.
- Actually fetching the view and setting the selection.
- It is unclear if defining a formal API will be much simpler or worth the effort.
- We'll start with Deltas solution. We don't expect any changes required from Platform
- Using the new Global debug toolbar in platform
- There is a system property to know if the debug view toolbar is enabled or not
- It is better to use the command framework to contribute new buttons
- The global toolbar should work automatically for the Visualizer once it is a DebugContextProvider. However, if the Visualizer and Debug view are not synchronized, the debug tool bar will take the context from the currently active view; this can be quite confusing to the user. We really need to synchronize the two views.
- DebugContextProvider can be used for any view to provide the debug context. This is important if someone uses the visualizer without the Debug view. The problem is that there is no API to drive the selection in the Debug View. There are two current options:
Enhanced breakpoints
- Windriver is working on the different bugs internally and will post something to the bugs once available
DSF Context persistence
- Bug 306554 Add support to persist cast to type / view as array settings
- New patch posted to provide context persistence
Expressions view additions
- Enhancement to allow the expressions view to use Working Sets. The idea is to use Pin&Clone and Working sets to show only the expressions for a specific core (i.e. context)
- Demo will be shown at the next multicore debug call
Grouping
- Bug 336876
- Mentor is interested in the feature. Mikhail will see if time can be allocated to complete it.
EclipseCon
- Bill Swanson will attend and present
- Marc Khouzam will attend and present
- Can we have screensharing and phone conference for CDT day at EclipseCon?
November 8th, 2011
Attendees
- Phil Mason (Broadcom)
- Mikhail Khodjaiants (Mentor)
- Bruce Griffith (Sage)
- Abeer Bagul (Tensilica)
- Shaiju Nair (Tensilica)
- Bill Swanson (Tilera)
- Marc Khouzam (Ericsson)
Minutes
Visualizer view progress
- Bug 335027
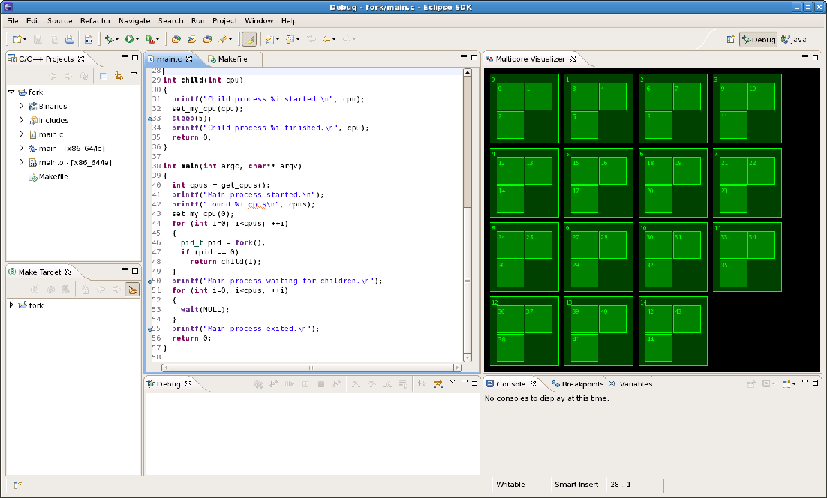
- More updates in GitHub for Multicore Visualizer. CPUs/Cores are shown, with threads overlayed on top.
- Arbitrary number of CPUs/cores are supported with a automatic layout
- Demo of Multicore Visualizer:
- We saw two cores on one CPU (that was the hardware on which the demo was running)
- Debugged a program with 5 threads, and we saw the threads move from one core to another as reported by DSF
- Resizing the view makes the cores larger/smaller as necessary
- Works with open-source GDB 7.3 (actually should be fine with GDB >= 7.1)
- Information on getting the code from GitHub can be found in the bug.
- Talk proposal will be submitted for EclipseCon 2012 to present this work
Global debug toolbar in platform
- With Platform M3, the Debug view will no longer have the resume/step/etc buttons in its own toolbar. Instead there will be a global debug toolbar.
- This is great for multicore as we can share the global debug toolbar between the Debug view and the Visualizer view
- Bug 258767 - [debug view][menu] support for top level debug toolbar
Enhanced breakpoints
- Windriver will start using CDT breakpoints in their products and plan on adding the following features.
- Bug 360280 - Reposition breakpoints when planted on invalid line
- Bug 360291 - Allow user to edit line breakpoint file in properties dialog
- Bug 360295 - Customize property dialog for editing breakpoints
- Bug 360289 - Allow address breakpoint to be set on arbitrary expression
- Bug 360588 - Allow user to edit all its properties prior to creating the breakpoint
DSF Context persistence
- Proposal: New DSF service using context hierarchy to create a persistant id name for a context
- Using this id to persist attributes of variables such as 'cast'
- Prototype is available and will be posted to bugzilla
October 25th, 2011
Note: The meeting request was not properly sent to the community. Due to this, attendance was dramatically smaller. We will hold another meeting in two weeks. Apologies for the mistake.
Attendees
- Abeer Bagul (Tensilica)
- Marc Khouzam (Ericsson)
Minutes
DSF Context persistence
- Tensilica needs to recognize a context as being the 'same' from one debug session to anohter. To do this, they propose to have a way to create a fully-qualified name for each DMContext.
- Abeer and Marc discussed possible solutions. A combination of a new DSF service and a set of adapters seemed interesting.
- Abeer will open a bug to describe the problem and the proposed solution.
Global debug toolbar in platform
- With Platform M3, the Debug view will no longer have the resume/step/etc buttons in its own toolbar. Instead there will be a global debug toolbar.
- This is great for multicore as we can share the global debug toolbar between the Debug view and the Visualizer view
- Bug 258767 - [debug view][menu] support for top level debug toolbar
Visualizer view progress
- Bug 335027
- Some progress done with a preliminary screenshot of the look & feel

Enhanced breakpoints
- Windriver will start using CDT breakpoints in their products and plan on adding the following features.
- Bug 360280 - Reposition breakpoints when planted on invalid line
- Bug 360291 - Allow user to edit line breakpoint file in properties dialog
- Bug 360295 - Customize property dialog for editing breakpoints
- Bug 360289 - Allow address breakpoint to be set on arbitrary expression
- Bug 360588 - Allow user to edit all its properties prior to creating the breakpoint
September 27th, 2011
Attendees
- Mikhail Khodjaiants (Mentor)
- Shaiju Nair (Tensilica)
- Patrick Chuong (TI)
- Dobrin Alexiev (TI)
- Bill Swanson (Tilera)
- Pawel Piech (Windriver)
- Marc Khouzam (Ericsson)
Minutes
General
- Tensilica has submitted a patch to handle breakpoints from the console. Mikhail is reviewing the patch as time permits.
- More patches will be submitted as progress is made
- Mikhail is working on synchronized stepping using multiple debug sessions (multiple GDBs)
- Problems with selection policy. The idea is to keep a multi-selection after a step. This is not supported by the platform.
- Problems with Pin&Clone in GdbPinProvider
- Could be related to the multicore synchronized operation feature
- Tensilica does something similar but programatically by stepping all sessions when one session is stepped.
- Tensilica has a need to handle expressions per context (core, etc) to avoid getting errors for every expression that does not apply.
- Windriver have done a change that adds a 'context' to the expression definition and based on that, filtering can be done. The user has to specify if the new expression is to be global or specific, and then some meta data is automatically stored to allow for the filtering. It was felt a little cumbersome.
Grouping
- Bug 336876
- Mikhail is interested in this feature
- Dobrin will have no time to work on it in the next month but can help someone else
- Many details on wiki
- Can someone else than Dobrin pick up where he left off? Mikhail may have some time in a couple of weeks
Enhanced breakpoints
- No progress yet.
Visualizer
- Bug 335027
- Progress is being made using the GitHub repo
- Marc takes care of the new DSF service needed. IGDBHardware and GDBHardware are defined and almost ready with basic functionality
- Bill takes care of the graphical parts
- Tensilica may be interested in extending the Multicore visualizer for their multicore setup
- We are considering using 'layers' where we can add other types of information to an existing visualizer e.g., CPU utilization
August 30th, 2011
Attendees
- Mikhail Khodjaiants (Mentor)
- Eugene Ostroukhov (Nvidia)
- Bruce Griffith (Sage)
- Abeer Bagul (Tensilica)
- Patrick Chuong (TI)
- Dobrin Alexiev (TI)
- Bill Swanson (Tilera)
- Randy Rohrbach (Windriver)
- Doug Schaefer (Windriver)
- Shaiju Nair (Tensilica)
- Marc Khouzam (Ericsson)
Minutes
General
- Tensilica will soon start submitting patches from their DSF integration. They are mostly to help subclassing.
- The multicore debug workgroup meetings will continue monthly
Grouping
- Still planned for Juno
- Tensilica is interested in getting this feature and can help
Visualizer
- Work has started and Bill has the beginnings of a framework.
- Discussion will be done in Bug 335027
- How to handle collaboration with Bill (not a committer) for Visualizer effort
- CDT's move to Git was largely to allow for such collaboration
- Doug is there to help with this collaboration to help workout issues.
- Could use GitHub as there is some CDT infrastructure already
- EclipseLabs is another option
- Once the plugins are at a point where they can be contributed, we can push them to eclipse.org.
- Such an eclipse.org contribution will be fine even if the work is done by multiple companies; we just have to have the different contributors but their name in the copyright notice
- Is this visualization limited to debugging or could it be extended to other aspects of CDT?
- For now, we focus on debug, but let's not close the door on other possibilities
- First contribution:
- Two new plugins for the framework: org.eclipse.cdt.visualizer.core and org.eclipse.cdt.visualizer.ui
- Separate example (reference implementation) plugins to create a visualizer that will be part of CDT
- First Visualizer suggestions/requirements?
- Restrict to information that is available from GDB
- Could use the two dimension ability to show process and threads, maybe cores, to improve on the tree view of the Debug view
- Selection of entities
- Grouping of entities
- Reporting state of entities using colors and labels
- Debug view is not scalable enough. Nvidia has to deal with thousands of threads. Filtering would be useful. The Visualizer view could be used to select which threads should be shown in the Debug view.
- How will the user identify threads of interest on the Visualizer? The visualizer view will need to show more information, such as hardware location and such.
- Highlighting of cores that have stopped due to a breakpoint would be nice for Tensilica (synchronized debugging)
- If interested parties can include usecases on the wiki or the bug, it will help determine what features are common and useful
- Using DSF?
- Yes, within the example plugins. Integration with DSF-GDB.
- As a second example we could have a non-debug example of how to use framework. This would be a separate effort though.
Enhanced breakpoints
- No progress
July 26th, 2011
Attendees
- Mikhail Khodjaiants (Mentor)
- Bruce Griffith (Sage)
- Shaiju Nair (Tensilica)
- Dobrin Alexiev (TI)
- Bill Swanson (Tilera)
- Randy Rohrbach (Windriver)
- Marc Khouzam (Ericsson)
Minutes
General
- Shaiju working on synchronizing breakpoints between gdb console and UI.
- Bug 308385
- Shaiju will post a patch when ready.
- Mikhail is hoping to be able to review.
- The solution will be based on the CDI approach because support for older GDBs is needed for Tensilica.
- For newer GDBs (>= 7.3), which are not yet available, we will have breakpoint events we can use.
Visualizer
- Bill has implemented a first draft of the framework APIs as plugins
- Has reimplemented Tilera's existing Grid View on top of these APIs
- Will need a generic Presentation (hopefully based on DSF) to be able to see things with Vanilla CDT
- Will need to look at SelectionProvider platform API for context selection
- Next step is to review current state of implementation
- Marc to work on this feature with Bill starting end of August
Grouping
- Dobrin is working on TI's product for the next month and won't have time to work on this until then
- Marc to look at the patch end of August or September
- Abeer expects to also be able to help out around August
- Dobrin is also working on run control operation for multiple selections
- Fine tuning needed to know what to do if the different selections are of different types (thread/process/stack)
Enhanced breakpoints
- Tensilica has a new dialog to specify a core when setting a breakpoint a bit like thread-specific breakpoint. Core-specific breakpoints fit right into the enhanced breakpoint feature.
- Interest still high, but no time made available yet.
June 21st, 2011
Attendees
- Mikhail Khodjaiants (Mentor)
- Patrick Chuong (TI)
- Bill Swanson (Tilera)
- Doug Schaefer (Windriver)
- Abeer Bagul (Tensilica)
- Marc Khouzam (Ericsson)
Minutes
- TI integrating Indigo before looking at next steps for muticore features
- Tensilica still porting to DSF-GDB but is planning on helping get the Grouping feature ready for CDT
- Ericsson planning on focusing on Grouping and Visualizer features in the coming months
Grouping
- Marc expects to have time to get back to this in August
- Abeer expects to also be able to help out around that time
Visualizer
- Bill is making good progress in moving to more recent CDT
- Almost ready to start working on visualizer
- Two approaches:
- port tilera-view to recent CDT and then generalize to define framework
- first design the general visualizer framework and then build Tilera's Grid view on top of it
- ready to have dedicated talks about this effort
- Bill and Marc prepared to spend time on this effort, others welcome
OS-Awareness
- Feature has been developed but not yet contributed to open-source
Global breakpoints
- Have been proposed on GDB mailing list: http://sourceware.org/ml/gdb-patches/2011-06/msg00163.html
- Once part of GDB, we will need to integrated in CDT
Enhanced Breakpoint support
- Feature of high interest, but needs a champion
May 24th, 2011
Attendees
- Mikhail Khodjaiants (Mentor)
- Dobrin Alexiev (TI)
- Patrick Chuong (TI)
- Randy Rohrbach (Windriver)
- Shaiju Nair (Tensilica)
- Marc Khouzam (Ericsson)
Minutes
Grouping
- Tensilica trying to get multi-core working on their own platform. Some issues with Debug view updates. Tried grouping patch with HEAD with good success. Now needs to adapt it for Tensilica's changes.
- Dobrin is hoping to resume work on the Grouping effort once the Indigo release is done and the branch is available for new features.
Enhanced breakpoints
- TI does not have the resources to lead this effort, but can be part of discussions.
- It would be nice to find a champion for this feature
- First step is to list requirements on wiki and agree on features of interest. After that we can divide the effort between different people, to make it easier.
April 26th, 2011
Attendees
- Mikhail Khodjaiants (Mentor)
- Shaiju Nair (Tensilica)
- Dobrin Alexiev (TI)
- Patrick Chuong (TI)
- Marc Khouzam (Ericsson)
Minutes
Meeting schedule
- Because people are very busy with the Indigo release, we will have montly meetings until things pick up on the multicore front. Next meeting on the 24th of May.
Grouping
- Only the last patch of bug 336876 needs to be applied.
- The user has to set an environment variable GDB_DEBUG_VIEW_GROUPS to 1 to use the feature
- If the user selects 2 or more elements in the debug view, and right-clicks, he will see "Group" and "Ungroup"
April 12th, 2011
Attendees
- Norman Yee (Analog Devices)
- Ken Ryall (Nokia)
- Bruce Griffith (Sage)
- Dobrin Alexiev (TI)
- Patrick Chuong (TI)
- Bill Swanson (Tilera)
- Doug Schaefer (Windriver)
- Marc Khouzam (Ericsson)
Minutes
EclipseCon meeting comments
- Very good meeting with lost of interest.
- Scaling of CDTs current features is not enough. The new features being discussed are essential.
- Lots of work needed to address all issues
- Visualization is key
- Some of these new features push the limits of the existing architecture and we should address those at an architecture level.
Status
- Dobrin continues to work on grouping but having many issues with changing context-hierarchy. Changes are pretty big and may not be safe for the Indigo release.
- Patrick is interested looking at enhanced breakpoint feature. We need to start a discussion and propose features
- Marc has been working on Multi-process. CDT will support automatically attaching to forked processes. For example, to debug the Chrome browser where each tab is a process, DSF-GDB will allow to automatically start debugging any new tab that is forked.
Visualizer view
- Bill would like to get his builds to work properly with the newer eclipse before looking at Visualizer view
- We should get more information about Coherent Logix' visual view as input for the Visualizer
- Nicely using colors but not relying solely on them will need to be discussed
- Zest has promising features, especially for graphs
Plans for Indigo
- Get multi-process all fixed for Indigo
- Grouping will probably not make it due to the large impact of changes
Plans post-Indigo (Juno)
- Enhanced breakpoints
- Visualizer. When work will start is unclear yet.
- Other features as people get time allocated.
March 23rd, 2011 - EclipseCon Workshop
We had a special meeting at EclipseCon where we were able to meet face-to-face. We talked about many different things and the discussions where very interesting although we covered so many topics, I had trouble keeping track.
Fundamental points to note:
- There is a lot of interest in this effort. Many companies do similar things and would like to unify them in CDT.
- The problem is vast and complex. Requirements need to be clarified. Discussions need to continue.
Attendees
- Tim Cook (Coherent Logix)
- John Cortell (Freescale)
- Jesper Eskilson (IAR Systems)
- Mario Pierro (IAR Systems)
- Greg Watson (IBM)
- Al Rossi (NCSA)
- Bruce Griffith (Sage)
- Dobrin Alexiev (TI)
- Patrick Chuong (TI)
- Onur Akdemir (Tubitak)
- Ugur (Tubitak)
- Aaron Spear (VMWare)
- Pawel Piech (Windriver)
- Doug Schaefer (Windriver)
- Dominique Toupin (Ericsson)
- Marc Khouzam (Ericsson)
Proposed topics
- CoherentLogix demo
- Current status and what is coming (from GDB) soon
- What can be re-used/shared in PTP?
- Visualization/Visualizer feature
- Launching/Attaching
- What do we need from Debug Platform?
- Dealing with complexity in Eclipse
- What does the user really want? Features, usability, quality, ...?
- Changing connection paradigm e.g., using RSE (Target Management in general) from CDT
- Automatic discovery
- Scalability
- Debugging virtual cores
Some of what was discussed
CoherentLogix demo
- The HyperX IDE is CDT with DSF-GDB slightly modified. Does not use GDB but has a simulator that talks GDB/MI.
- Grid representation. Hard-coded similarly to Tilera. This would be a different Presentation for the Visualizer view.
- When launching, the view gets populated with the hard-code layout, but reads the position of tasks and routes from a backend. Task state is show by color (green, yellow, red).
- The Grid view can show multiple chips. This means there are multiple grid views within the main grid view.
- Colors from the Grid view are also used in the DV.
- Editor show with a green dots on the lines where breakpoints can be set. Setting breakpoint is not done for all cores, instead, they require a launch first and then the user selects the core and then the green dots show only for the code that runs on the chosen task. Existing bp show in the editor only when the right context is selected.
- They re-use the outline view to show different information based on some other select view.
- Uses the Properties view to show information about debug elements
- They also use ZEST from some graph representation.


Visualization
- A lot of interest in the Visualizer view feature.
- CoherentLogix showed another Presentation
Scope of debugger
- What should the CDT debugger address? We talked about how tracing needs to be used to isolate a problem when dealing with a large complex application. Once the problem is isolated, we then want to use traditional debugging. This debugging should allow to focus on multiple threads and cores.
Open-MP
- New directives that allow you to parallelize the code e.g., unrolling loops. How do we debug such a situation? For example, when setting a breakpoint, what does it mean.
Relative debugging
Scaling
Integrating Target-Management with Debugging
Kernel vs Application debugging
- Bare-metal, Jtag, Kernel and application debugging have different requirements.
Synchronization of two debug context providers
Target explorer view
- Provided by TCF and provides a nicer UI than the RSE 'remote systems' view.
- It has an editor showing all the processes on the target. The plan is to have a context-menu to attach the debugger. Because it already uses TCF services to the target, it is easy to use the TCF debugger service.
- Suggested feature was to drag-and-drop a process into the debug view to start debugging.
UI scripting
- TI has javascript using Rhino that allows you to use a command-line to control the UI. Open/close views and such things.
- It also allows to write scripts that can do complex things like create a new launch, fill the data, and launch the debugger.
- This can also be used as UI test automation.
Graphical representation of data structures
- Is there interest in showing data/data structures in a graphical fashion? Some companies already do this.
- The view detail pane can be used to show such things.
March 8th, 2011
Attendees
- Mikhail Khodjaiants (Mentor)
- Abeer Bagul(Tensilica)
- Shaiju Nair (Tensilica)
- Dobrin Alexiev (TI)
- Patrick Chuong (TI)
- Pawel Piech (Windriver
- Doug Schaefer (Windriver)
- Marc Khouzam (Ericsson)
Minutes
API freeze
- Does not affect provisional/internal/experimental APIs
Global action set for "C/C++ Advanced Debugging"?
- Ultimately all new UI should be under its own actionSet
- ActionsSets should then be enabled/disabled automatically, when we figure out if they are of interest to the user
- Sometimes it is not possible to know that an actionSet should be enabled.
- We could create a perspective for 'multicore', although this may add confusion
- Need to allow to turn off pin&clone button visibility
- Currently capabilities can be used for products but are not so good for CDT itself
- Bug 246243 shows how to toggle buttons in view using the Command framework
- For Indigo, we'll have a global action set for the new 'multicore' features. It will need to be enabled manually. It should include Pin&Clone, Grouping and Multi-process (if necessary).
EclipseCon multicore debug workshop
- 1:20pm on Wednesday. Marc to email the list
Visualizer view
- Need an automated build
Grouping
- Feature does not affect existing functionality and can be kept off unless conciously enabled
- Patch waiting review
- Patch includes UI to group for DSF-GDB or DSF debuggers that implement the new service
Multi-process
- Multiple consoles (one per process) is supported
- Terminating individual processes is supported
- Will commit patch to stop showing the inferior in the debug view. This is the approach taken by EDC and TI's commercial product. We can revert if we don't like it.
- Need a way to allow the user to create a new process. Will add a button or entry in the Attach dialog; this is rudimentary as it does not allow for cutomization, but it will allow some users to try it out and exercise the code.
- Single process attach on windows no longer show list of processes for GDB < 7.0
Synchronized operations
- no progress, working on migration to DSF
Using multiple GDBs in a single launch
- Different options are possible
- Multiple DSF sessions. Probably need changes in the VM nodes
- Multiple commandControl service. Changes will be in the services
- Showing multiple models under the same launch
February 22, 2011
Attendees
- Norman Yee (Analog Devices)
- John Cortell (Freescale)
- Mikhail Khodjaiants (Mentor)
- Ken Ryall (Nokia)
- Bruce Griffith (Sage)
- Salvatore (ST Microelectronics)
- Abeer (Tensilica)
- Shaiju Nair (Tensilica)
- Dobrin Alexiev (TI)
- Patrick Chuong (TI)
- Bill Swanson (Tilera)
- Pawel Piech (Windriver
- Doug Schaefer (Windriver)
- Marc Khouzam (Ericsson)
Minutes
Pin&Clone feature completed
- Now fully available in HEAD (including icon overlay)
- Available for Variables, Expressions, Registers, Memory Browser and Disassembly
- To add Pin&Clone to other views (e.g., not in open-source)
- Add the two buttons to the view using extension point
- When calling addDebugContextListener once must use the interface that uses the secondary id
Visualizer view
- Looking for a way to Headlessly build CDT
- LinuxTools seem to have a package to build called "eclipse-build"
- org.eclipse.cdt.releng/build.sh is used to build all of CDT, along with the PDE build
- Marc was not able to work on this due to other features that are planned for Indigo
Grouping
- Dobrin working on model to create groups
- The plan is to be able to group anything
- There will be an API to control what is allowed to be grouped for different debuggers
- Dobrin will post a new patch soon
Synchronized operations
- Shaiju currently working on migrating Tensilica debugger to DSF
- Bug 336788 available for comments
Multi-process
- Attaching to multiple processes in the same session is pertty much working with HEAD (GDB 7.2)
- Issue with context hierarchy for breakpoints where the breakpoint target does not contain the pid of the process when starting to track the breakpoints, but does contain the pid when we want to stop tracking bps, which makes the equality check fail. See Bug 336890
- What do we do about the inferior process?
- We need the inferior process for the IO console and to monitor the life of the process
- We don't necessarily need to show this process in the Debug View. Both EDC and TI have removed that entry.
- Another option is to create a group of inferiors in the DV if there is more than one inferior
- If we remove inferior, we can still show the proper console when selecting a process (container) instead of when selecting the inferior
- TI has a technique to remember if the user last used the IO or debugger console and show it accordingly
- Do we want to support Terminating a single process from Eclipse? If so, we also need to do it when selecting a container
- We could even remove the 'gdb' entry (not as useful since there is only one)
- Marc will prototype something to remove the inferior and see how it feels
- Console
- Have one console per process for IO
- Maybe have a global console for output (seems hard for input), but we may need to prefix each line of output, if that is possible
- Don't have a console for attach processes since their IO is not from eclipse
- Inferior that runs to completion, how to show in DV?
- When inferior dies we just stop showing it, like we do for threads that complete
Multicore debug workshop at EclipseCon
- Marc to email attendees off-line and suggest timeslots
Enhanced Breakpoint Support
- Patrick gave a very nice demo of TI's advanced breakpoint support, below are some of the things shown
- breakpoint per target
- unassigned bp can be added to targets after the target is started
- bp properties are provided by the backend
- XML file used to provide set of properties
- ability set all properties before creating the bp
- ability to create a bp is a disabled state
- uses flexible hierarchy and detail pane
- support for target actions
- support for extended host actions (e.g., enable group, show view)
- What are others doing? Should talk about it at the next meeting
- How do we include (some of) these features into open source? Which company can contribute some of their features?
February 8, 2011
Attendees
- Norman Yee (Analog Devices)
- Mikhail Khodjaiants (Mentor)
- Bruce Griffith (Sage)
- Shaiju (Tensilica)
- Dobrin Alexiev (TI)
- Patrick Chuong (TI)
- Bill Swanson (Tilera)
- Doug Schaefer (Windriver)
- Marc Khouzam (Ericsson)
Minutes
Multicore debug workshop at EclipseCon
- We are interested in having a multi-core debug meeting at EclipseCon. Using a BOF is too open and too late at night. We should find a time during the day. We should book a room or maybe use the courtyard. Marc to email foundation for a room.
Visualizer view
- First part is to work on the framework and the first presentation
- To make it easy to use without CDT, we probably want new plugins
How to build CDT?
- Tensilica builds from sources
- Tilera looks for a repeatable, automatable way to build CDT
- org.eclipse.cdt.releng has scripts to build CDT, uses AntRunner
- Need a wiki to explain how to build CDT from sources. Questions should be posted to the list until we figure this out.
Grouping
- Dobrin moving code changes from DSF-GDB to DSF
- Need people to test: https://bugs.eclipse.org/240208
- Dobrin is making TI's debugger work with the proposed changes
- next step after that is to define the UI
- Need to clarify concepts like:
- backend-supported groups
- frontend-only groups
- recursive grouping
- Need to investigate other commands than run-control that can affect groups such a 'load'
- Shaiju can try out the patch and provide feedback
- Mikhail will also try to get some time
- GDB will be doing some work on grouping and we should make sure it fits with what we need
Synchronized operations
- Post on the wiki on what Tensilica is doing: What Tensilica is currently providing.
- Need to get input from the community to get all requirements
- Builds on top of the grouping feature
- Tensilica does not use groups, but uses an all-or-nothing grouping approach
- Need a bugzilla for this effort, Shaiju opened https://bugs.eclipse.org/bugs/show_bug.cgi?id=336788
- http://bugs.eclipse.org/330974 for "live" grouping using multi-select
Multi-process UI
- UI has to be defined
- Marc almost done with plumbing for DSF-GDB using GDB 7.2
Pin&Clone
- Part of M2 build
- Coloring available in http://bugs.eclipse.org/334566
- Patrick almost done with patch for coloring
Enhanced Breakpoint Support
- TI has a better bp support using flexible hierarchy
- TI deals with breakpoint properties as provided by the backend
- TI creating breakpoints allow to set conditions and properties before creating the bp
- Demo next meeting of TI bp support
- Need to collect requirements
- consolidate things to one location
- creation with full properties before setting bp
- get info from backend
Next conference call will be in two weeks on Februrary the 22nd
January 25, 2011
Attendees
- Norman Yee (Analog Devices)
- Mikhail Khodjaiants (CodeSourcery)
- Aaron Spear (Mentor Graphics)
- Ken Ryall (Nokia)
- Shaiju (Tensilica)
- Dobrin Alexiev (TI)
- Patrick Chuong (TI)
- Bill Swanson (Tilera)
- Pawel Piech (Windriver)
- Doug Schaefer (Windriver)
- Marc Khouzam (Ericsson)
Minutes
Next conference call will be in two weeks on Februrary the 8th
Synchronized/Grouped Run Control Operations (Synchronous operations)
- A synchronous the operation is an operation that makes all elements in a group run in "lock-step" and stop at exactly the same time.
- A group leader is needed when doing a true sync operation to know when the operation is finished. For example a group of core 1, 2 and 3 can be requested to step with leader being core 2; the operation will step each core at the same time and will stop all three at exactly the point where core 2 (the leader) will finish its step
- Both Mentor and Ericsson use synchronous operations
- TI 'simulates' a sync operation in their backend by doing a tight async operation that is actually a full step of each element of the group, but that is done at the same time
- GDB has limited support for this kind of operation. The --all flag can be used and the scheduler-locking feature can help.
- Tensilica do a loop in the frontend to do individual steps for each group member.
- Tilera allows elements of the group to perform the operation only if the leader does not stop right away. The idea is to allow the user to focus on the process that has a problem. This is like all-stop except that when stepping the one process, the others should not move at all, or at least not until the current process progresses enough. "Why resume all the processes if they will be stopped again almost immediately because the main process has hit a breakpoint again".
- The eclipse support for this type of operation must be based on backend capabilities because different backend can support this in different ways. This can be achieved by having the DSF services perform the operation in the way their backend supports
- Some backend may support may of the synch/asynch/hybrid operations. Do we provide the user with a choice of what type of operation should be used?
- There seems to be high interest for such support in Eclipse so we suggest getting this effort started.
- Shaiju from Tensilica will try to get time allocated to work on this.
Global breakpoints
- Feature coming to GDB where a breakpoint can be set in a binary without specifying which process should be stopped. Any process hitting the breakpoint will be stopped and the debugger will attach to it.
- Which set of process does this global breakpoint apply to? All processes, a subset, current and new processes, etc. GDB will have support for such a configuration
- For Eclipse, using Global Breakpoint will greatly benefit from the task we identified and called "Enhanced breakpoint support"
Enhanced breakpoint support
- WindRiver would like to merge their breakpoint support with CDT. No timeline for it though. Who from WindRiver could be involved?
- There is high interest in the community and from different companies. We need to identify someone to lead this effort
Common changes
- Pawel agreed that changes that are to be used by multiple DSF debuggers can be put in DSF as long as backward compatibility is respected
- If he cannot find time to review such patches, they will need to be handled by other DSF commmitters
Visualizer view
- Bill posted a proposal and opened http://bugs.eclipse.org/335027
- Mikhail, Dobrin and Marc have already reviewed the document and will post comments to the bug. Others in the community are encouraged to do the same.
- Need more use-cases for harware types to be added the document
- If needed, we could have a separate conf call to address some question about this proposal
- Can we use GEF (Graphical Editing Framework) of Eclipse to help with the different 'Presentations' for this view?
- The framework would not use GEF, but the presentations could.
- Would PTP benefit of this framework? We should involve them, maybe at EclipseCon11
- This framework/view should be in its own plugins
Pin&Clone
- Feature available in CDT with an example in DSF-GDB. Can apply easily to DSF and non-DSF debuggers.
- Icons for pinning are still waiting to be committed
Grouping
- Multi-level hierarchy: Patch is ready but needs more testing
- Next step is to implement the grouping/hiding actions